Reporting tips & tricks: saving pivot table reports
In this article
We’ll guide you through saving and exporting pivot table reports with WebDataRocks. Learn how to save reports as JSON files for later use or share them with colleagues, and export them as HTML, Excel, or PDF for easy sharing.
Last time, you learned how to arrange fields on the grid and filter data records in a table.
In this tutorial, you will learn how to save your pivot table reports fast and conveniently.
As always, the entire process will be simple and comprehensive.
We are sure: saving your reporting results is as much important as gathering insights.
So, run your WebDataRocks demo, and let’s get started!
Terminology
But first, a bit of terminology.
WebDataRocks allows the saving and exporting of the analytical reports you design.
- You can save a report to the JSON file.
This approach allows you to pick your work up where you left off. Also, you can send this JSON file to your colleague and let them continue your work on the report.
- Also, you can export a report to HTML, Excel, or PDF files.
Use this approach if you want to share your ready-to-show report with teammates.
In this article, we’ll cover both approaches.
How to save a pivot table report via the UI
Let’s start with the simplest – saving and exporting reports using the visual controls of the pivot table.
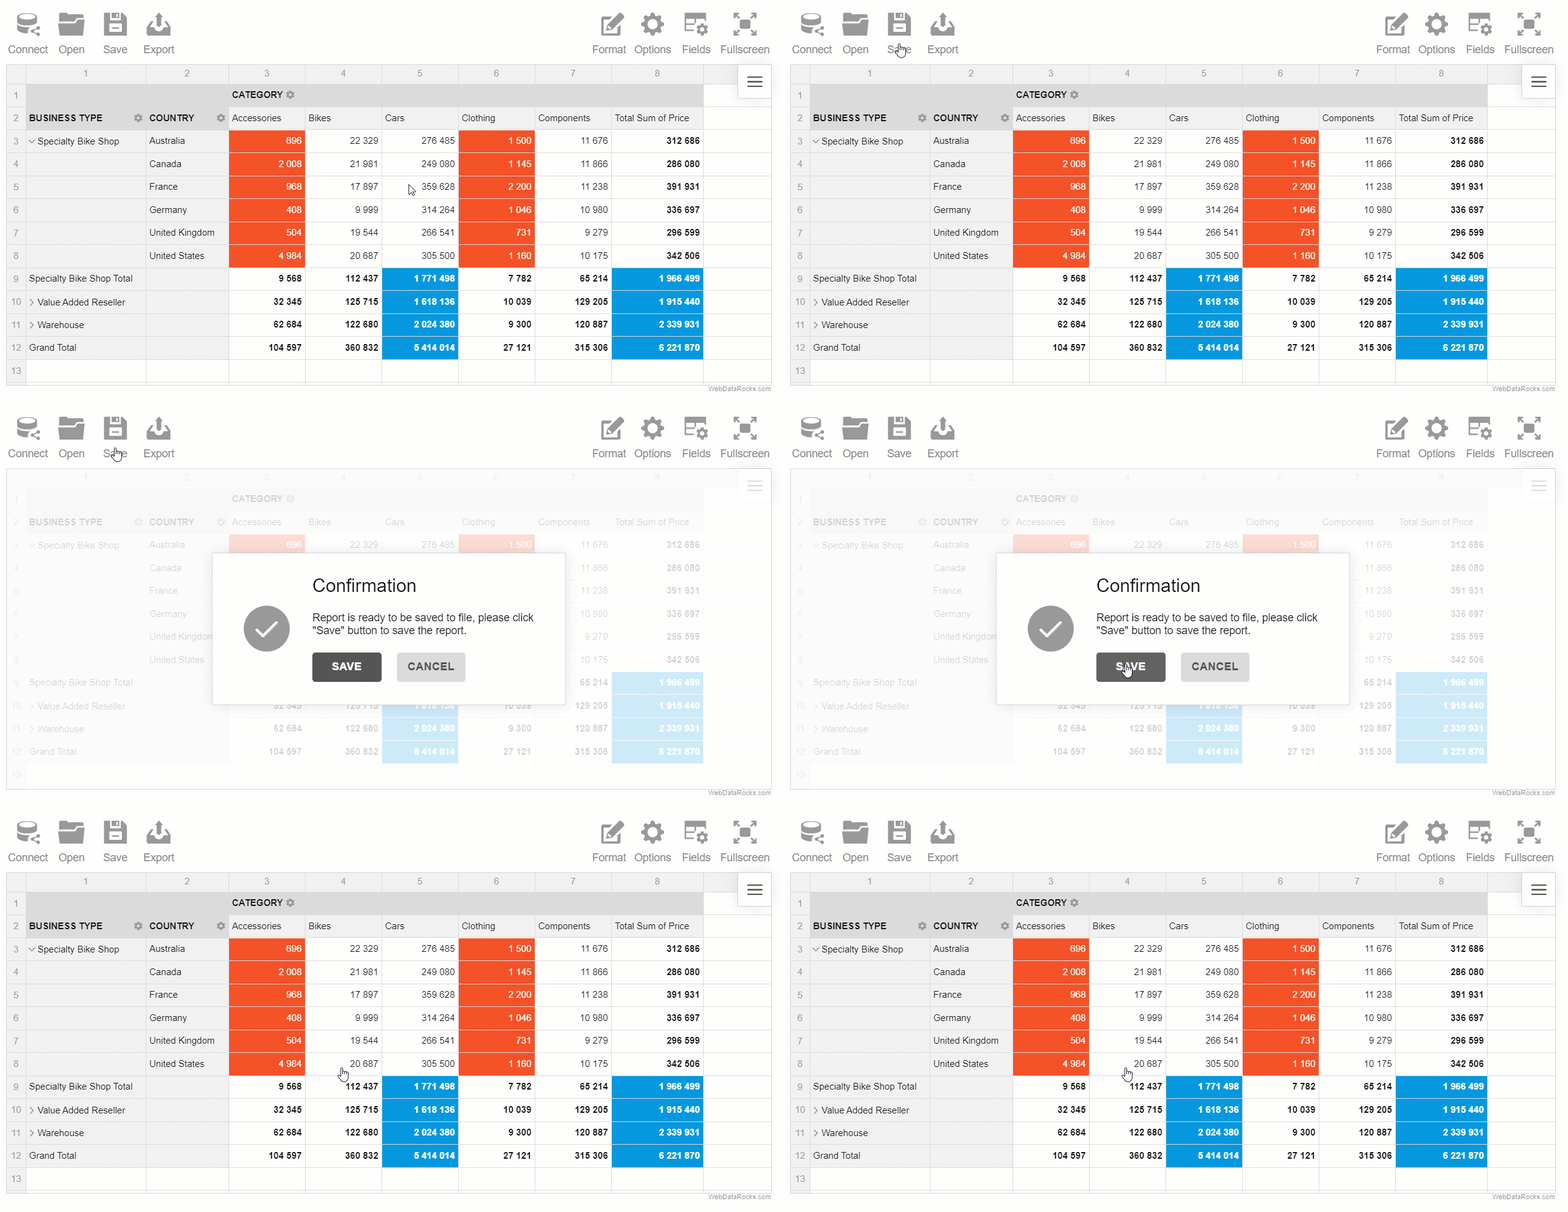
To save a report, click Save on the Toolbar.
Your report is started loading locally to your computer. Later, you can load this report into the pivot table and restore your previous work. The resulting file contains all the essentials: information about the data source, formatting, slice, sorting, filtering, and layout settings of the pivot table.

How to save a pivot table report with code
Let’s do the same but programmatically.
Use the save API method to save your report to a JSON file. You can either call it with default parameters or customize the result by specifying a file name, controlling a download destination, and more.
webdatarocks.save({ filename: 'myReport.json'});
If the destination is not specified, the report will be saved locally by default. To override this and save a report to the remote server, set destination to server and configure other server-related settings.
Yes, it’s as simple as one line of code.
How to export a pivot table report via the UI
Let’s see how to generate a PDF, Excel, or HTML file with a pivot table report.
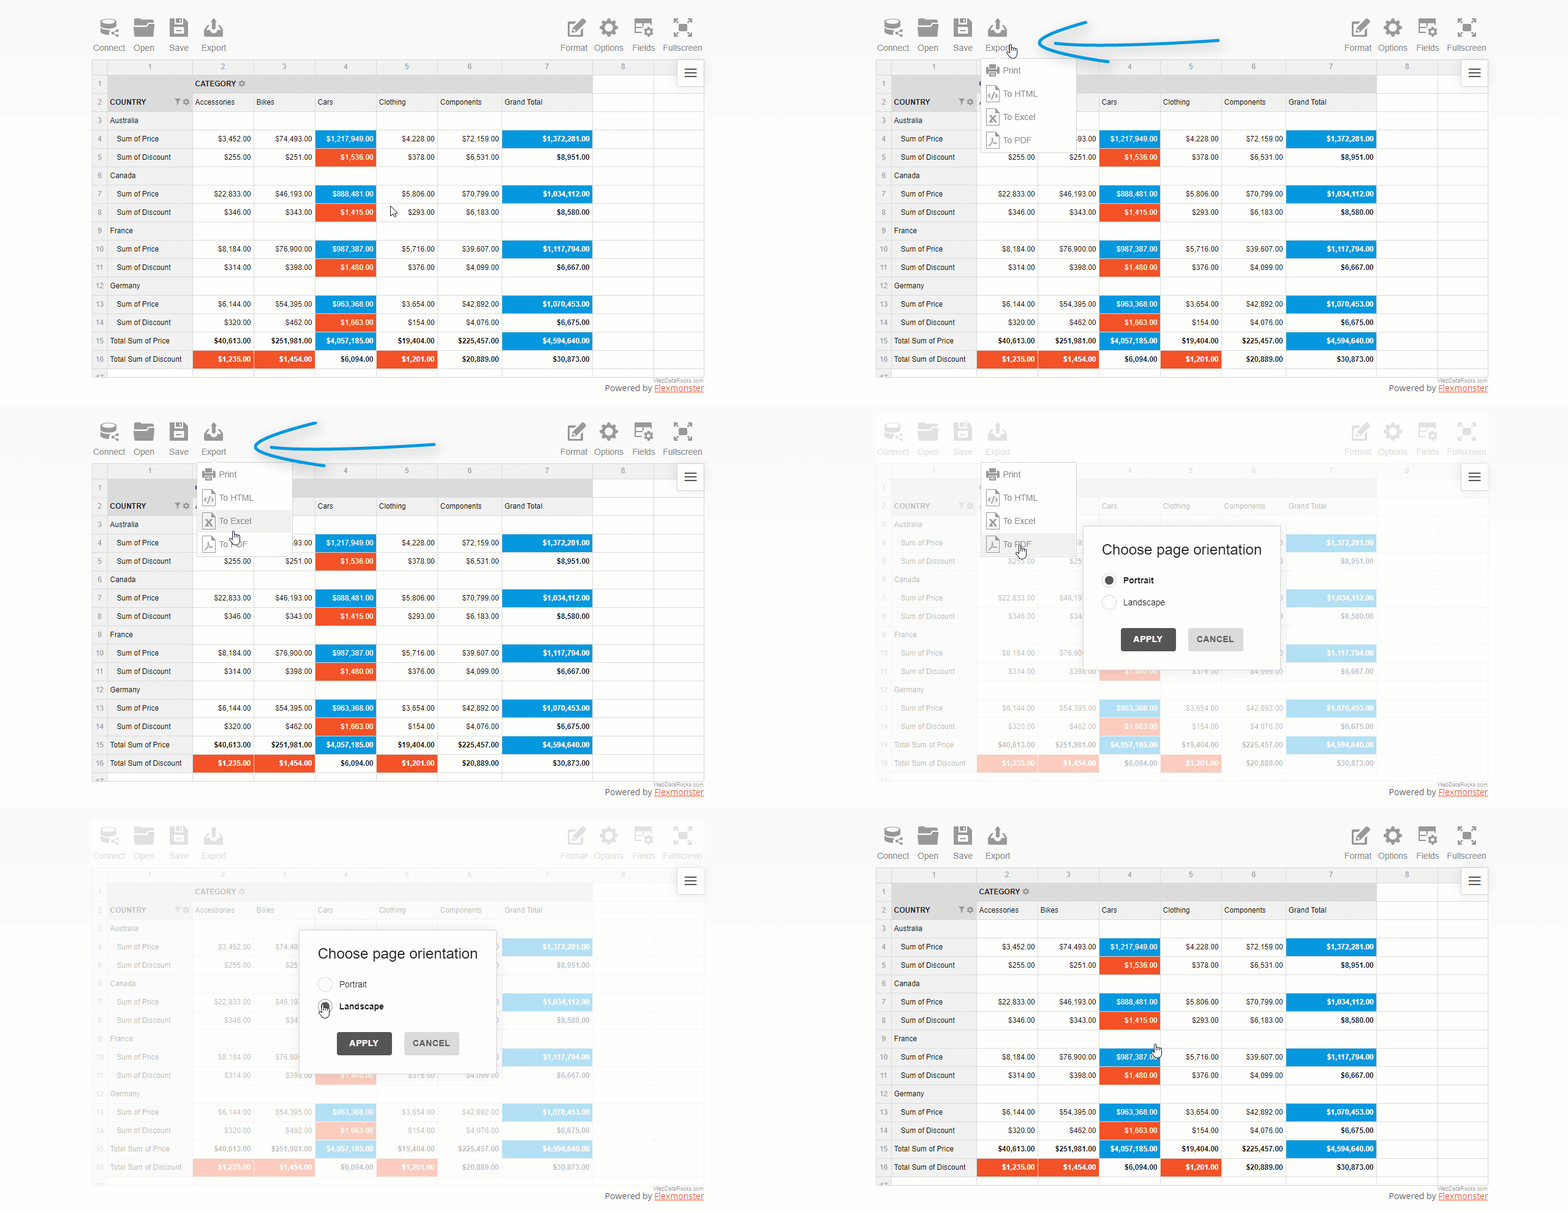
Click Export on the Toolbar and select the format type in which to save your report.
In the case of the PDF export, you can choose the orientation of your report: portrait or landscape.

How to export a pivot table report with code
As in the case of saving reports, all you need is a single API call – exportTo. In addition to the file type, there are a lot of parameters you can configure: the file name, a destination, an Excel sheet name, headers/footers for PDF and HTML files, and more.
Here’s how you can export your pivot table report to a local Excel file:
webdatarocks.exportTo("excel");
Congratulations! Now you can save and share the results of your valuable work.
Demos
- Saving a pivot table report locally
- How to export a pivot table to Excel
- How to export a pivot table to PDF


