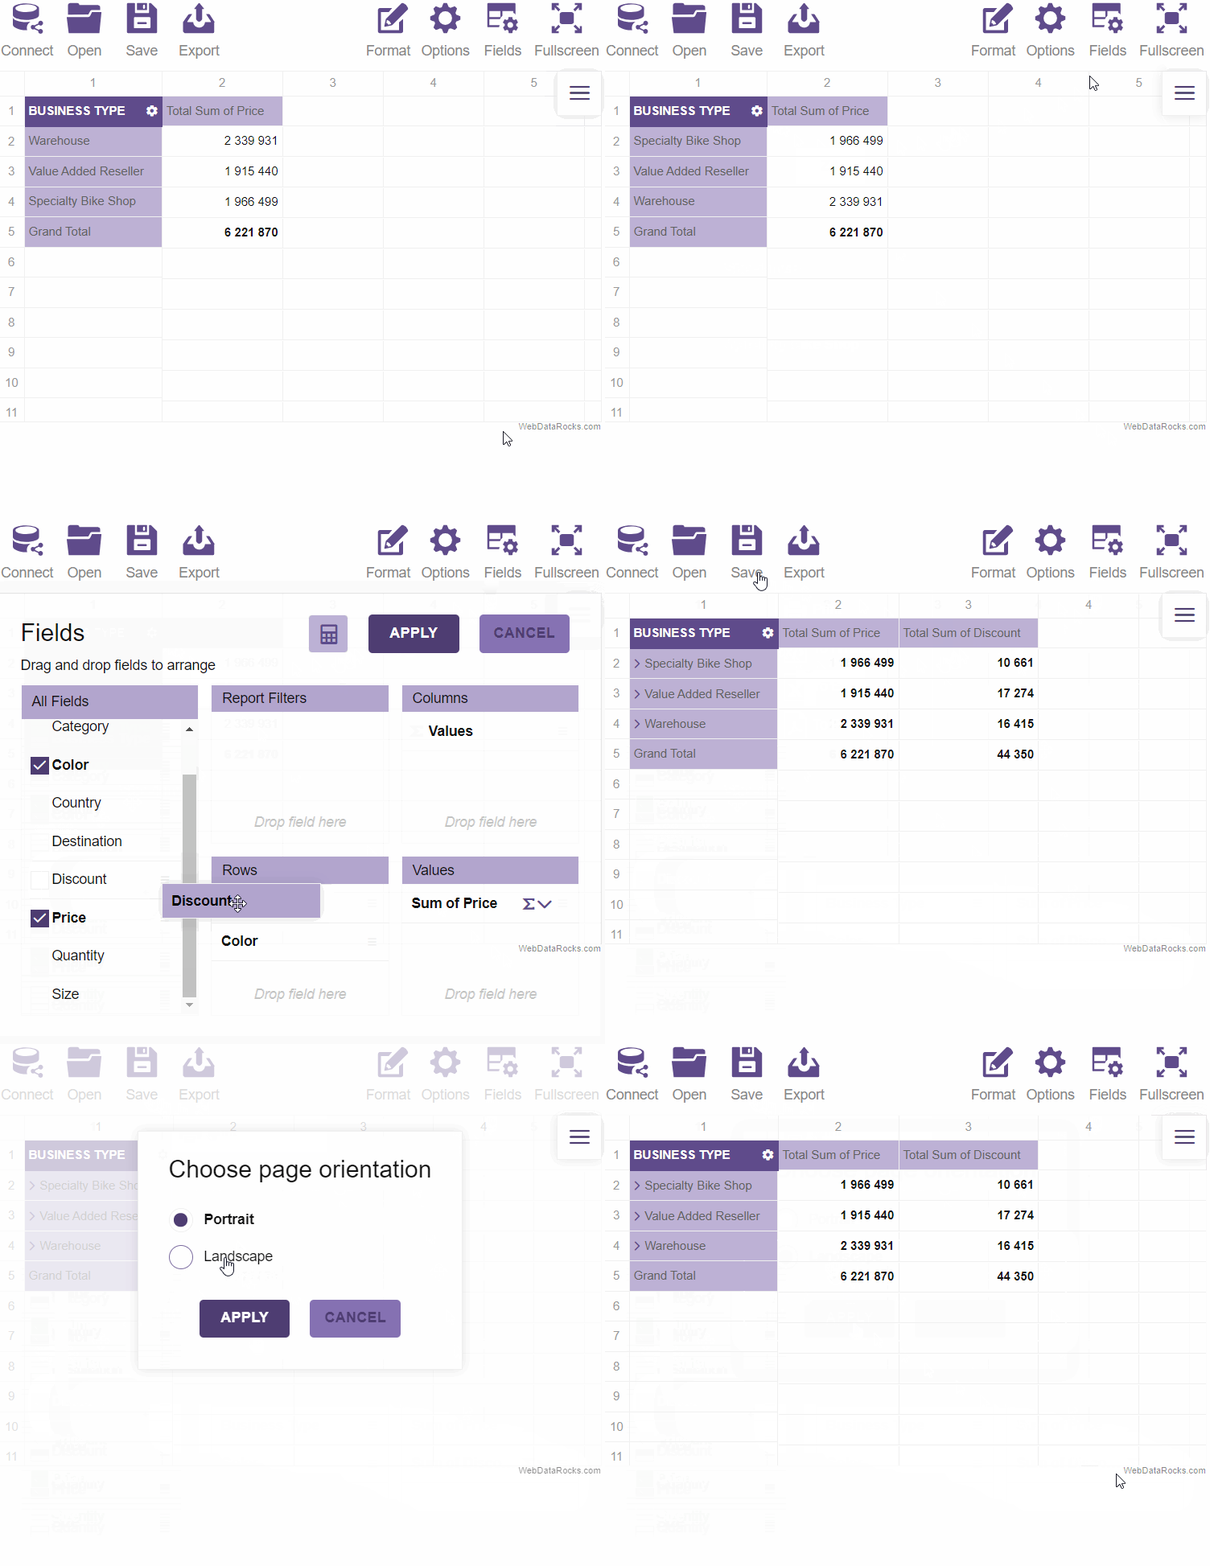
Simple Way to Analyze Complex Data Online
Quickly transform complex data into meaningful insights with its drag-and-drop interface and advanced features. Learn about solution that is ideal for both developers and business users.

Quickly transform complex data into meaningful insights with its drag-and-drop interface and advanced features. Learn about solution that is ideal for both developers and business users.

We’re excited to announce exciting updates to WebDataRocks! Dive into our latest release and discover powerful new aggregation functions like median, standard deviation, and running totals.

Correlation is a key statistical concept for understanding how variables relate. This article focuses on visualizing these relationships using charts, essential tools for assessing predictive models and exploring potential cause-and-effect connections.
Learn how to highlight trends in your data by substituting individual values with custom icons.

JSON is all about making data easy to understand and share. Think of it as a super-simple way to store information that computers and humans can both read. Check out our top picks for JSON validators to clean up your data before diving into your analysis.

It’s time to discover charts for one of the most common types of data analysis – a comparison over time.

Whether you need to match your branding or enhance readability during long data analysis sessions, our dark theme is your go-to solution. Learn how to set it!

Be creative! Design our own theme to make your web reporting tool look stylish and laconic.

Want to make this pivot table fit into the overall design of your project? WebDataRocks offers a set of predefined themes which you can use to customize the look of your web reporting tool.

Discover how to connect your Excel data to WebDataRocks’ live demo for interactive analysis. Follow simple steps to clean, export, and display your data on the grid, ensuring a seamless and secure experience.