Simple Way to Analyze Complex Data Online
Quickly transform complex data into meaningful insights with its drag-and-drop interface and advanced features. Learn about solution that is ideal for both developers and business users.

Quickly transform complex data into meaningful insights with its drag-and-drop interface and advanced features. Learn about solution that is ideal for both developers and business users.


This step-by-step tutorial will help you integrate WebDataRocks with amCharts. Our tutorial is based on the V4 of amCharts. Step 2. Add amCharts Step 2.1. Include the scripts for amCharts into your web page: <script src=”https://www.amcharts.com/lib/4/core.js”></script><script src=”https://www.amcharts.com/lib/4/charts.js”></script><script src=”https://www.amcharts.com/lib/4/themes/animated.js”></script> Find more information about other ways of amCharts installation in the official amCharts documentation. Step 2.2. Apply […]

This guide will walk you through the integration of WebDataRocks Pivot Table with Django – a Python web development framework. Upon completion, you will get a Django application empowered with reporting functionality. Prerequisites Get the latest or specific-release version of Python 3 and install Django on your machine. We recommend using the latest versions of […]

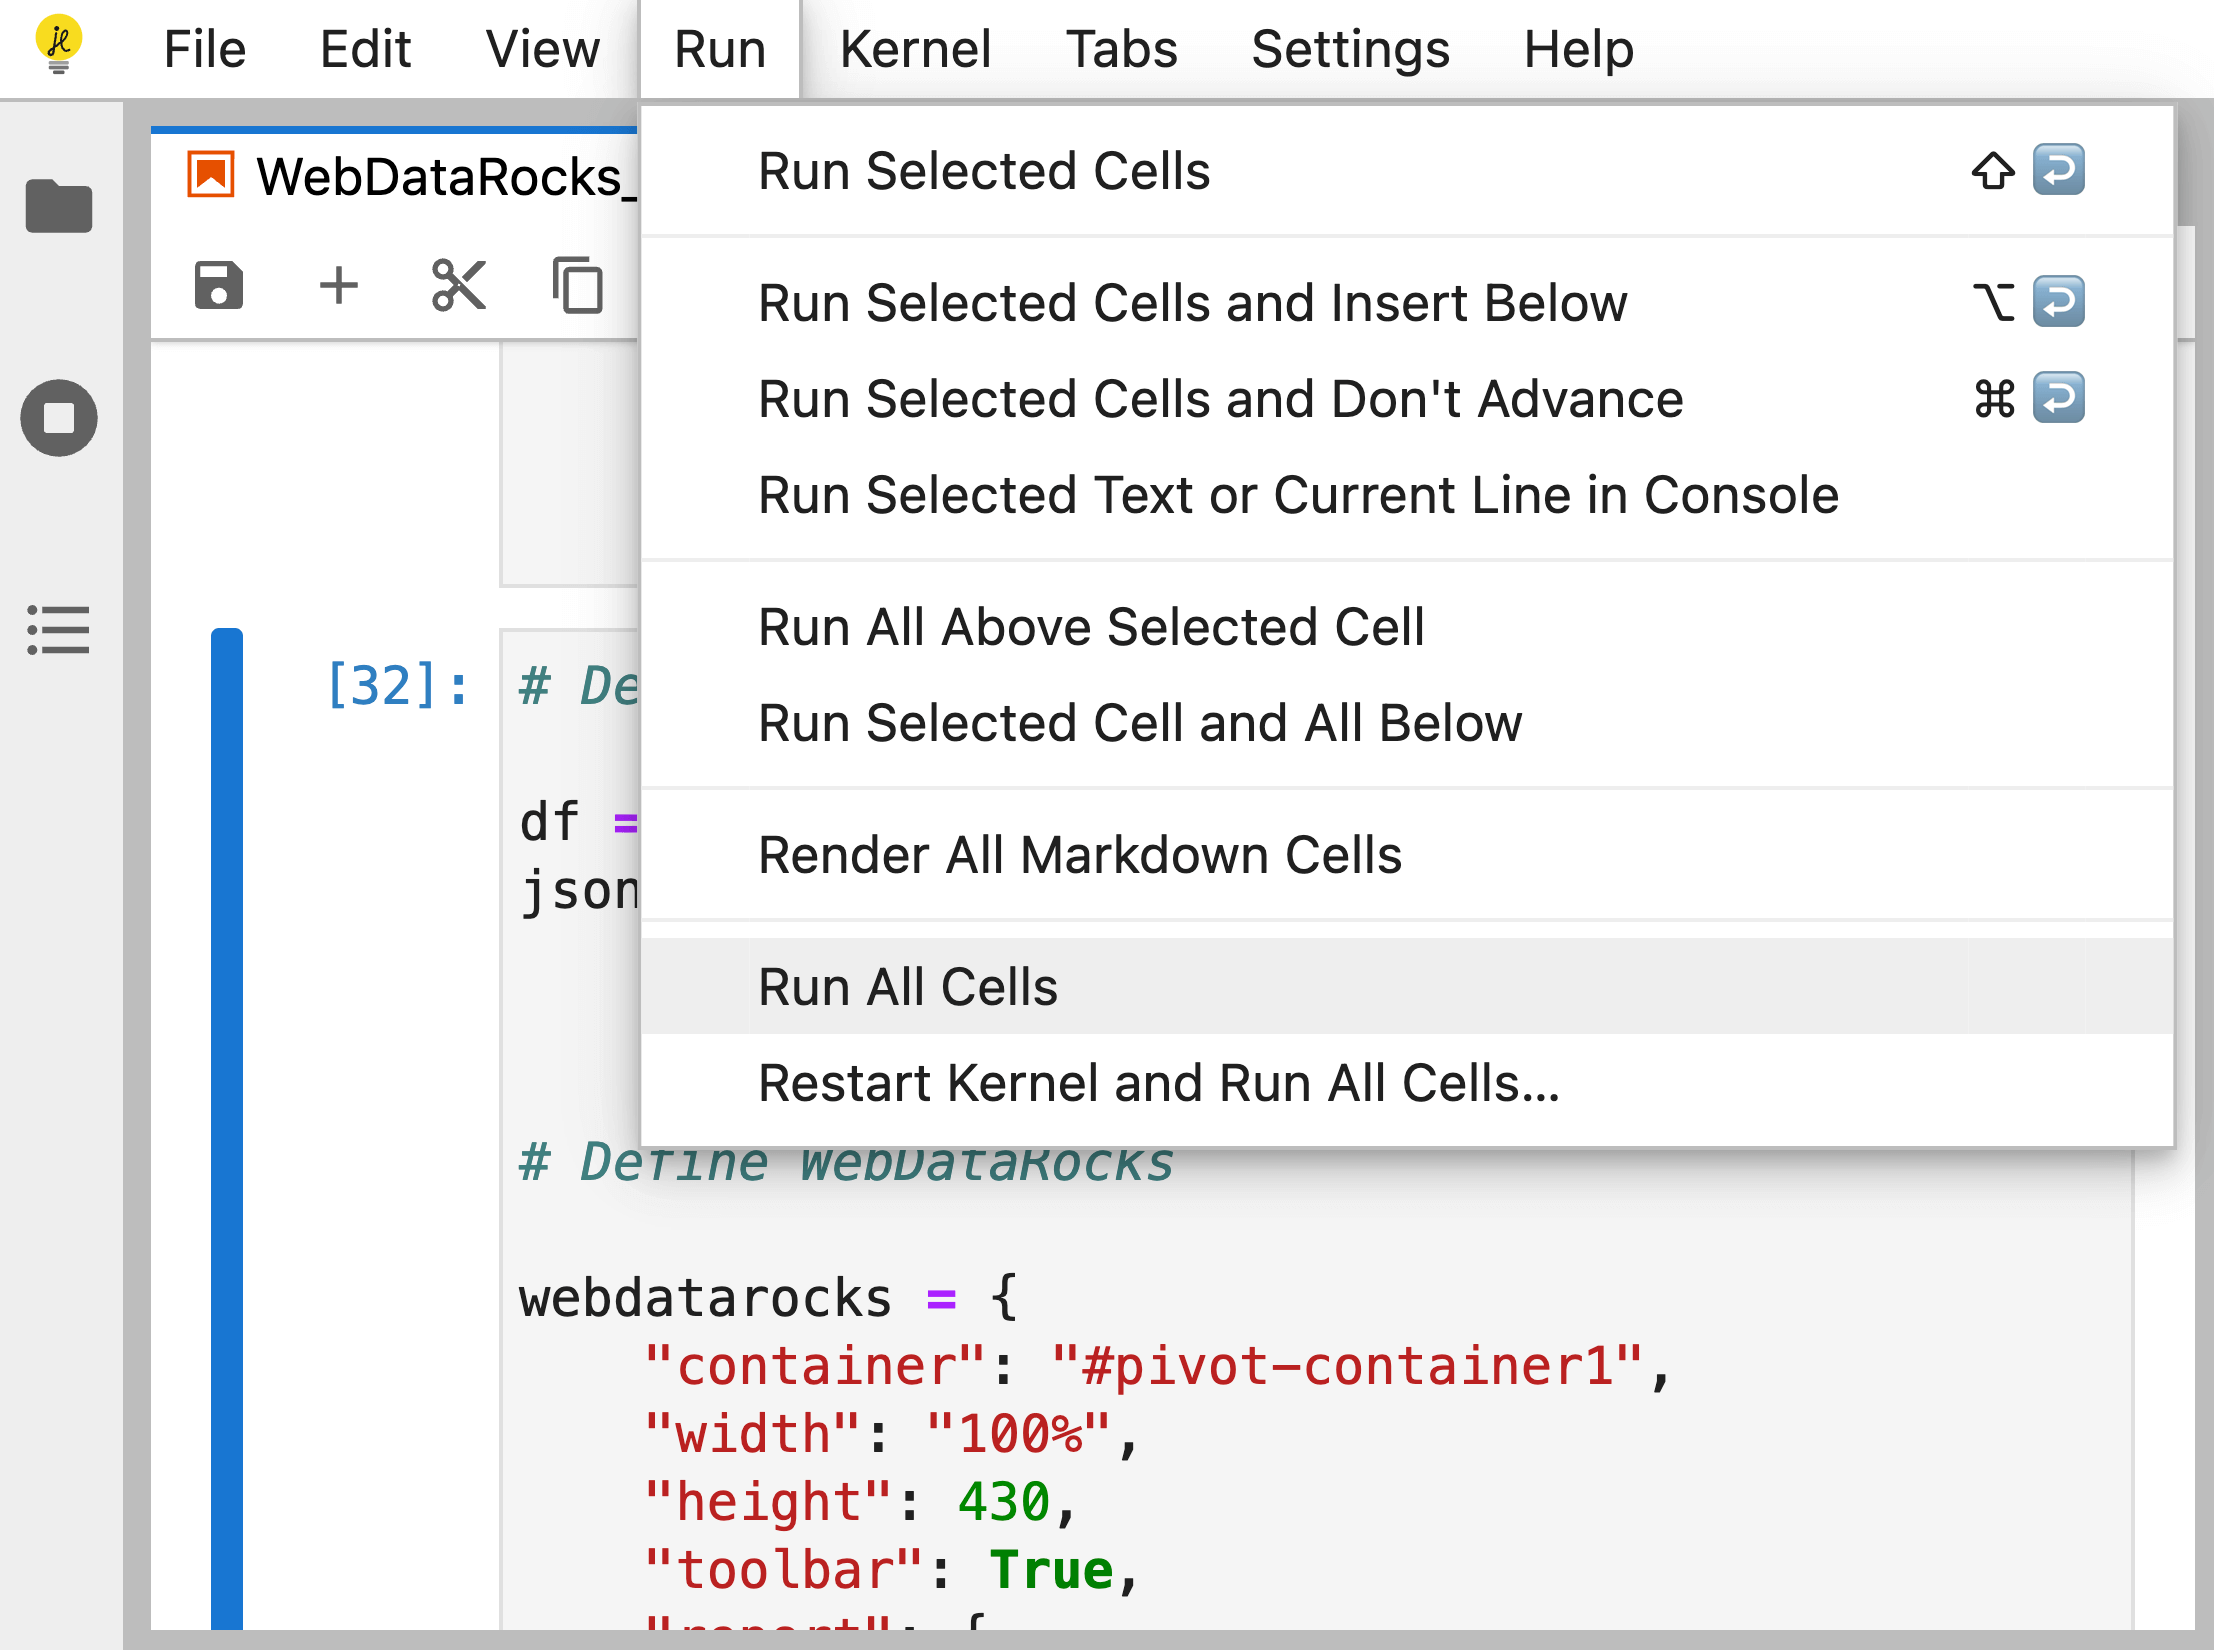
This tutorial will guide you through the process of integrating WebDataRocks Pivot Table with Jupyter – a web-based interactive application for sharing notebooks with live code, visualizations, text, and other media. As a result, you will get a notebook empowered with a pivot table for interactive data exploration and data analysis. Prerequisites Before installing a […]

FusionCharts is a charting library that provides a wide range of interactive charts, maps, and graphs. This tutorial describes how to integrate WebDataRocks with FusionCharts and visualize your data from the component. Please follow these steps to integrate your pivot table component with FusionCharts. Step 2. Add FusionCharts Step 2.1. Include fusioncharts.js into your web page: […]


In this tutorial, you will learn how to integrate WebDataRocks with jQuery. jQuery is a JavaScript library which purpose is to simplify using JavaScript on your website. It helps to handle HTML/DOM/CSS manipulation, HTML event methods, AJAX calls, and more. Step 1. Create a new project Step 1.1. Create a new folder for the project, […]