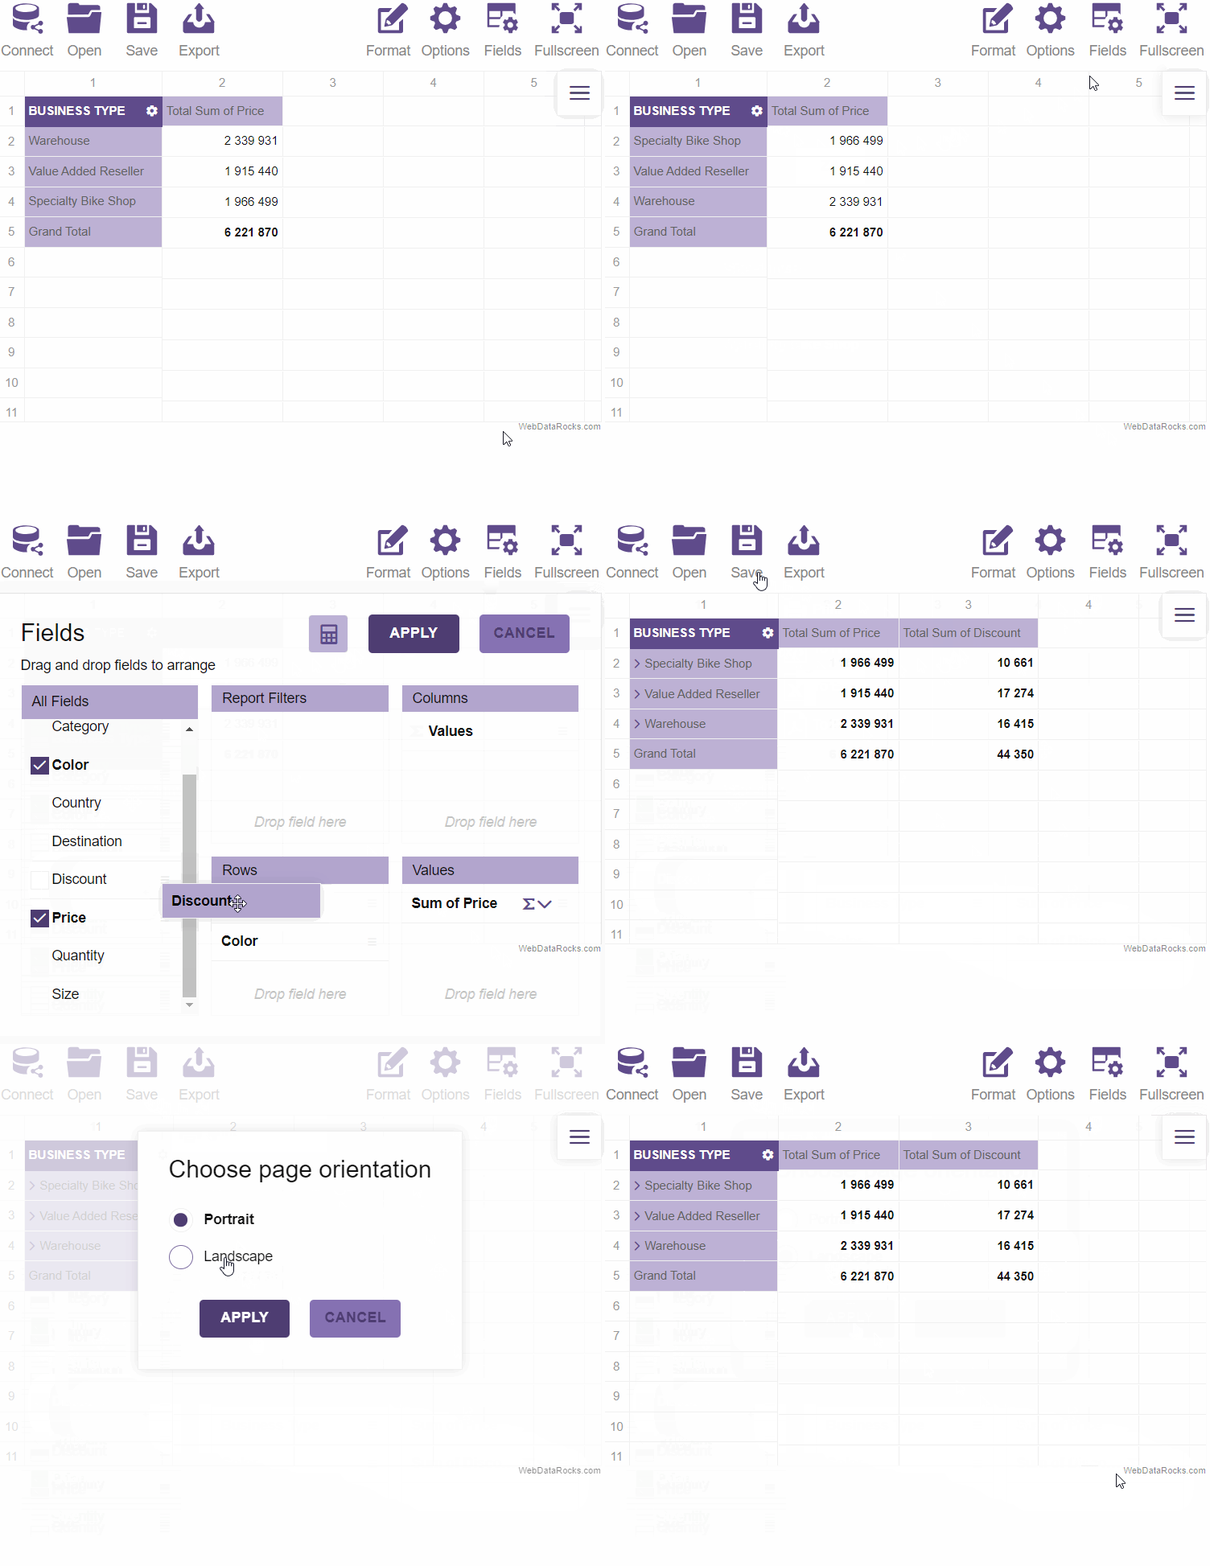
Simple Way to Analyze Complex Data Online
Quickly transform complex data into meaningful insights with its drag-and-drop interface and advanced features. Learn about solution that is ideal for both developers and business users.

Quickly transform complex data into meaningful insights with its drag-and-drop interface and advanced features. Learn about solution that is ideal for both developers and business users.

This tutorial walks you through creating a personalized sales dashboard, from defining objectives to integrating WebDataRocks and Google Charts, preparing and loading data, creating reports, and binding charts to the pivot table.

Learn how to enhance digital marketing report with WebDataRocks pivot table.

It’s time to discover charts for one of the most common types of data analysis – a comparison over time.

Charts and graphs enhance data storytelling by making information more digestible. This article highlights the history, types, and best practices for using charts, emphasizing readability, consistent style, and effective color choices. Use these tips to create clear, impactful presentations.

Whether you need to match your branding or enhance readability during long data analysis sessions, our dark theme is your go-to solution. Learn how to set it!

We know that working with dates and displaying them the way you want are tricky tasks for programmers.With the pivot table, you are able to format dates according to your business logic.

Be creative! Design our own theme to make your web reporting tool look stylish and laconic.

Want to make this pivot table fit into the overall design of your project? WebDataRocks offers a set of predefined themes which you can use to customize the look of your web reporting tool.

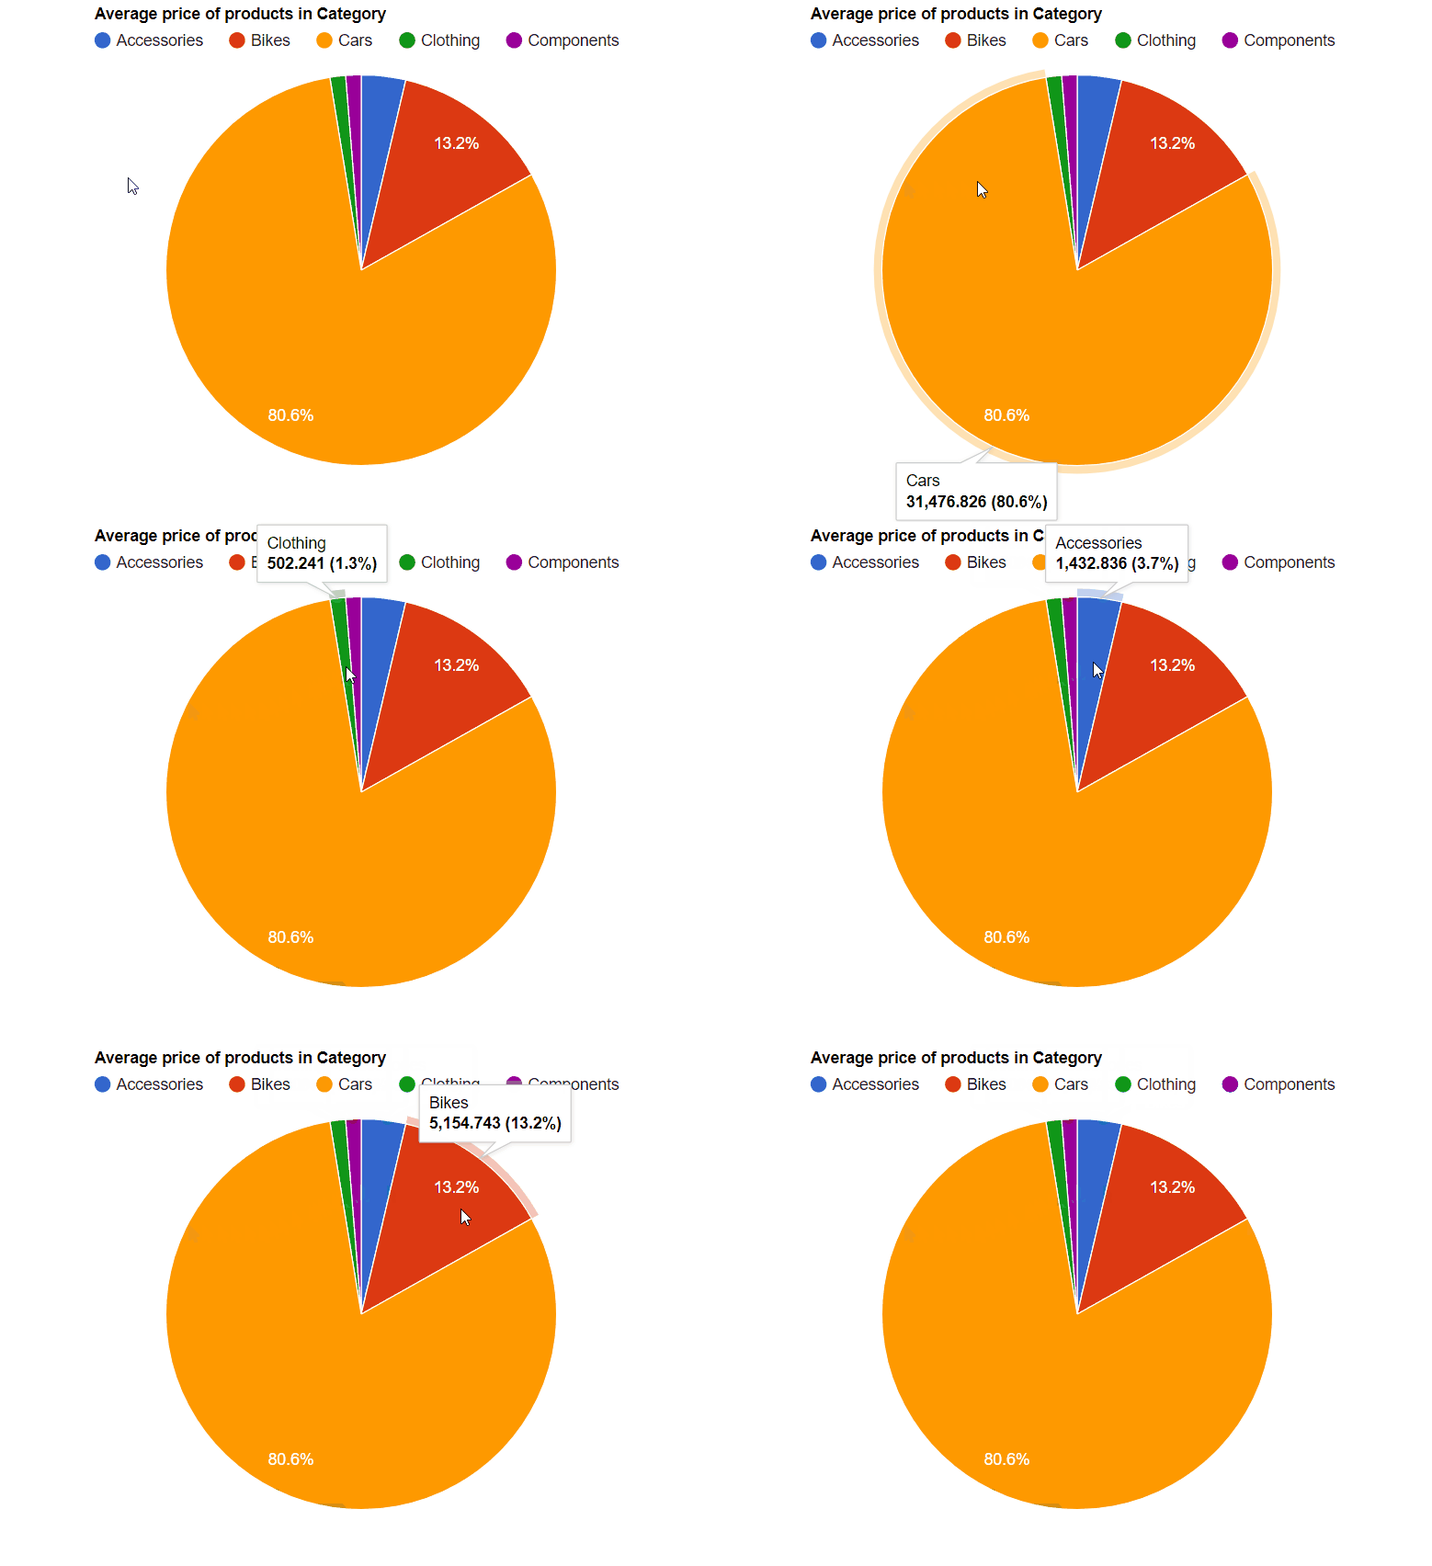
Do you want to make your web report look more interactive and appealing? To help you emphasize on the visual representation of your data, WebDataRocks supports integration with Google Charts library.

This article explains how to quickly start using WebDataRocks pivot grid in your AngularJS applications.