Who Stands Behind WebDataRocks?

We are a team of data enthusiasts and industry experts that work on enterprise tools like Flexmonster Pivot Table & Charts, and DataTableDev. With vast experience in developing data visualization libraries, we brought WebDataRocks to life, and are glad you like it!

WebDataRocks Pivot Table - Free JavaScript library for data visualization & analysis | Product Hunt

Our Story

Since 2008, our journey began with the development of Flexmonster Pivot Table & Charts, our pioneering web reporting software library.


In 2017, we launched WebDataRocks Pivot Table out of a vision to make data analysis more accessible and affordable for all. Our commitment didn't go unnoticed, as we finished in the top 5 products of the day on Product Hunt.

Today, WebDataRocks is trusted by thousands. Seeing developers worldwide embrace our technology
brings us immense joy.

For developers by developers illustration

For developers by developers

We took into account the most common programming and reporting challenges the developers face.

So now, developers can easily incorporate analytical elements into web projects, while data analysts gain access to Excel-like features for creating interactive web reports.

The component is well-supported with documentation, blogs, examples, to help you get the most out of our tool.

As a result, you get a free, easy-to-use pivot grid that can be integrated into any website or application.

It offers a number of data analytical features: filtering, sorting, grouping, conditional and number formatting, calculated values, and more.

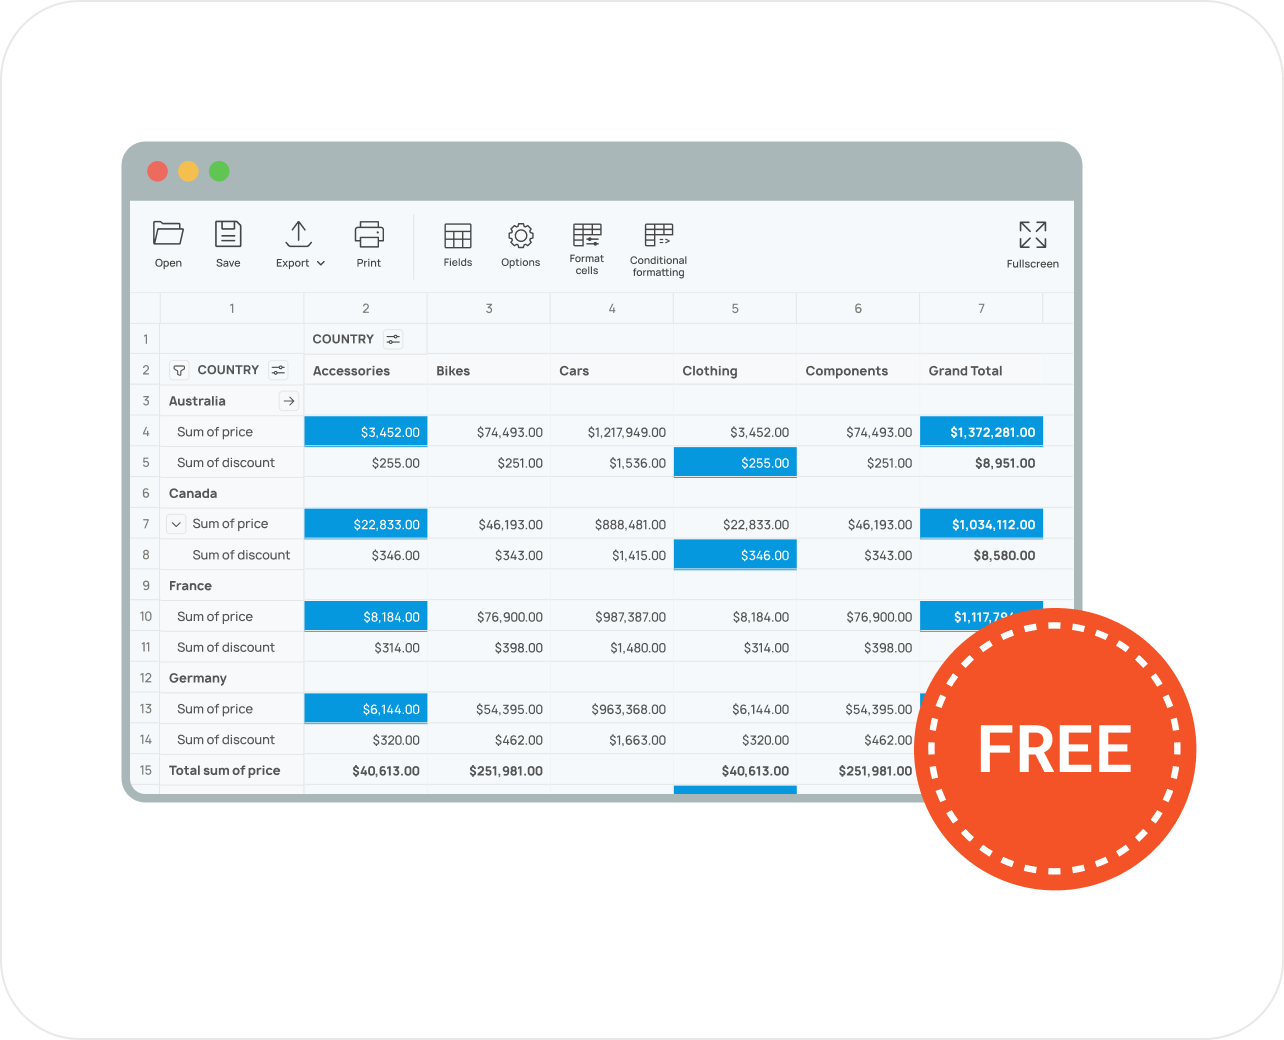
And Yes, it's FREE illustration

And Yes, it's FREE

We've been in this industry for years. We know how hard it is to find effective and easy analytics tools. At the same time, we deeply understand the importance of having such a tool at hand in the modern world. That is why we want more nonprofit and for-profit projects to have an accessible and powerful solution for their software.

Now, it's time to create your first pivot table