Free Web Pivot Grid Component
A feature-rich JavaScript pivot table library for creating interactive reports inside your app or
website.
Created by industry experts.
A feature-rich JavaScript pivot table library for creating interactive reports inside your app or
website.
Created by industry experts.
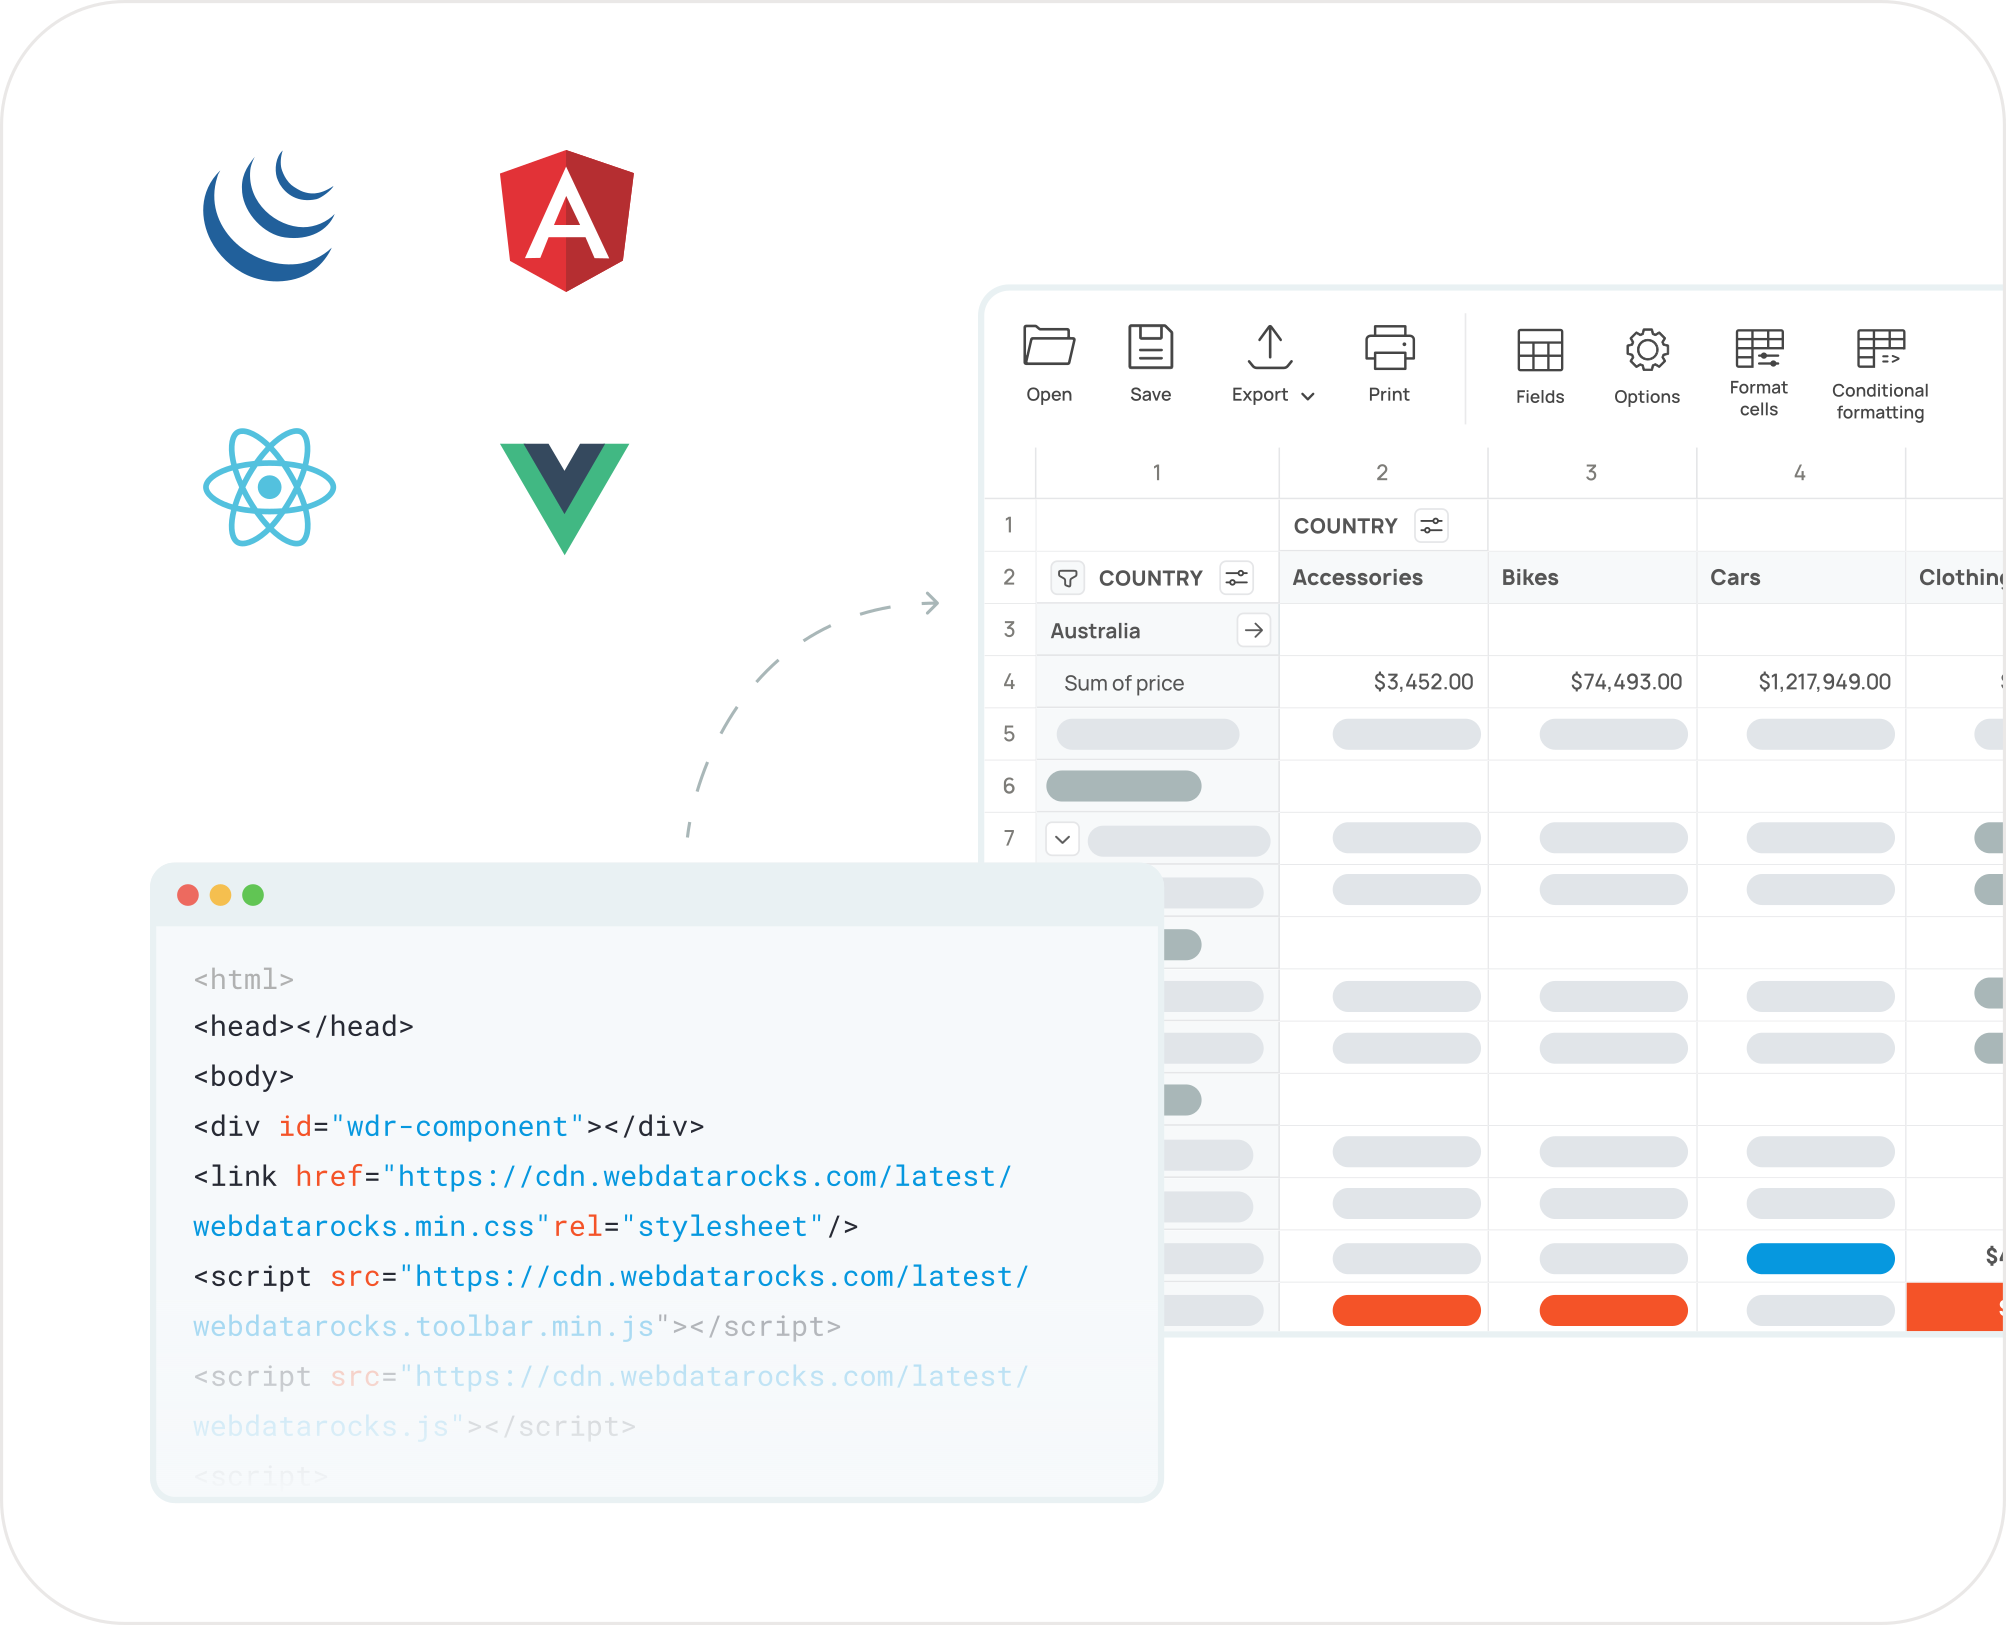
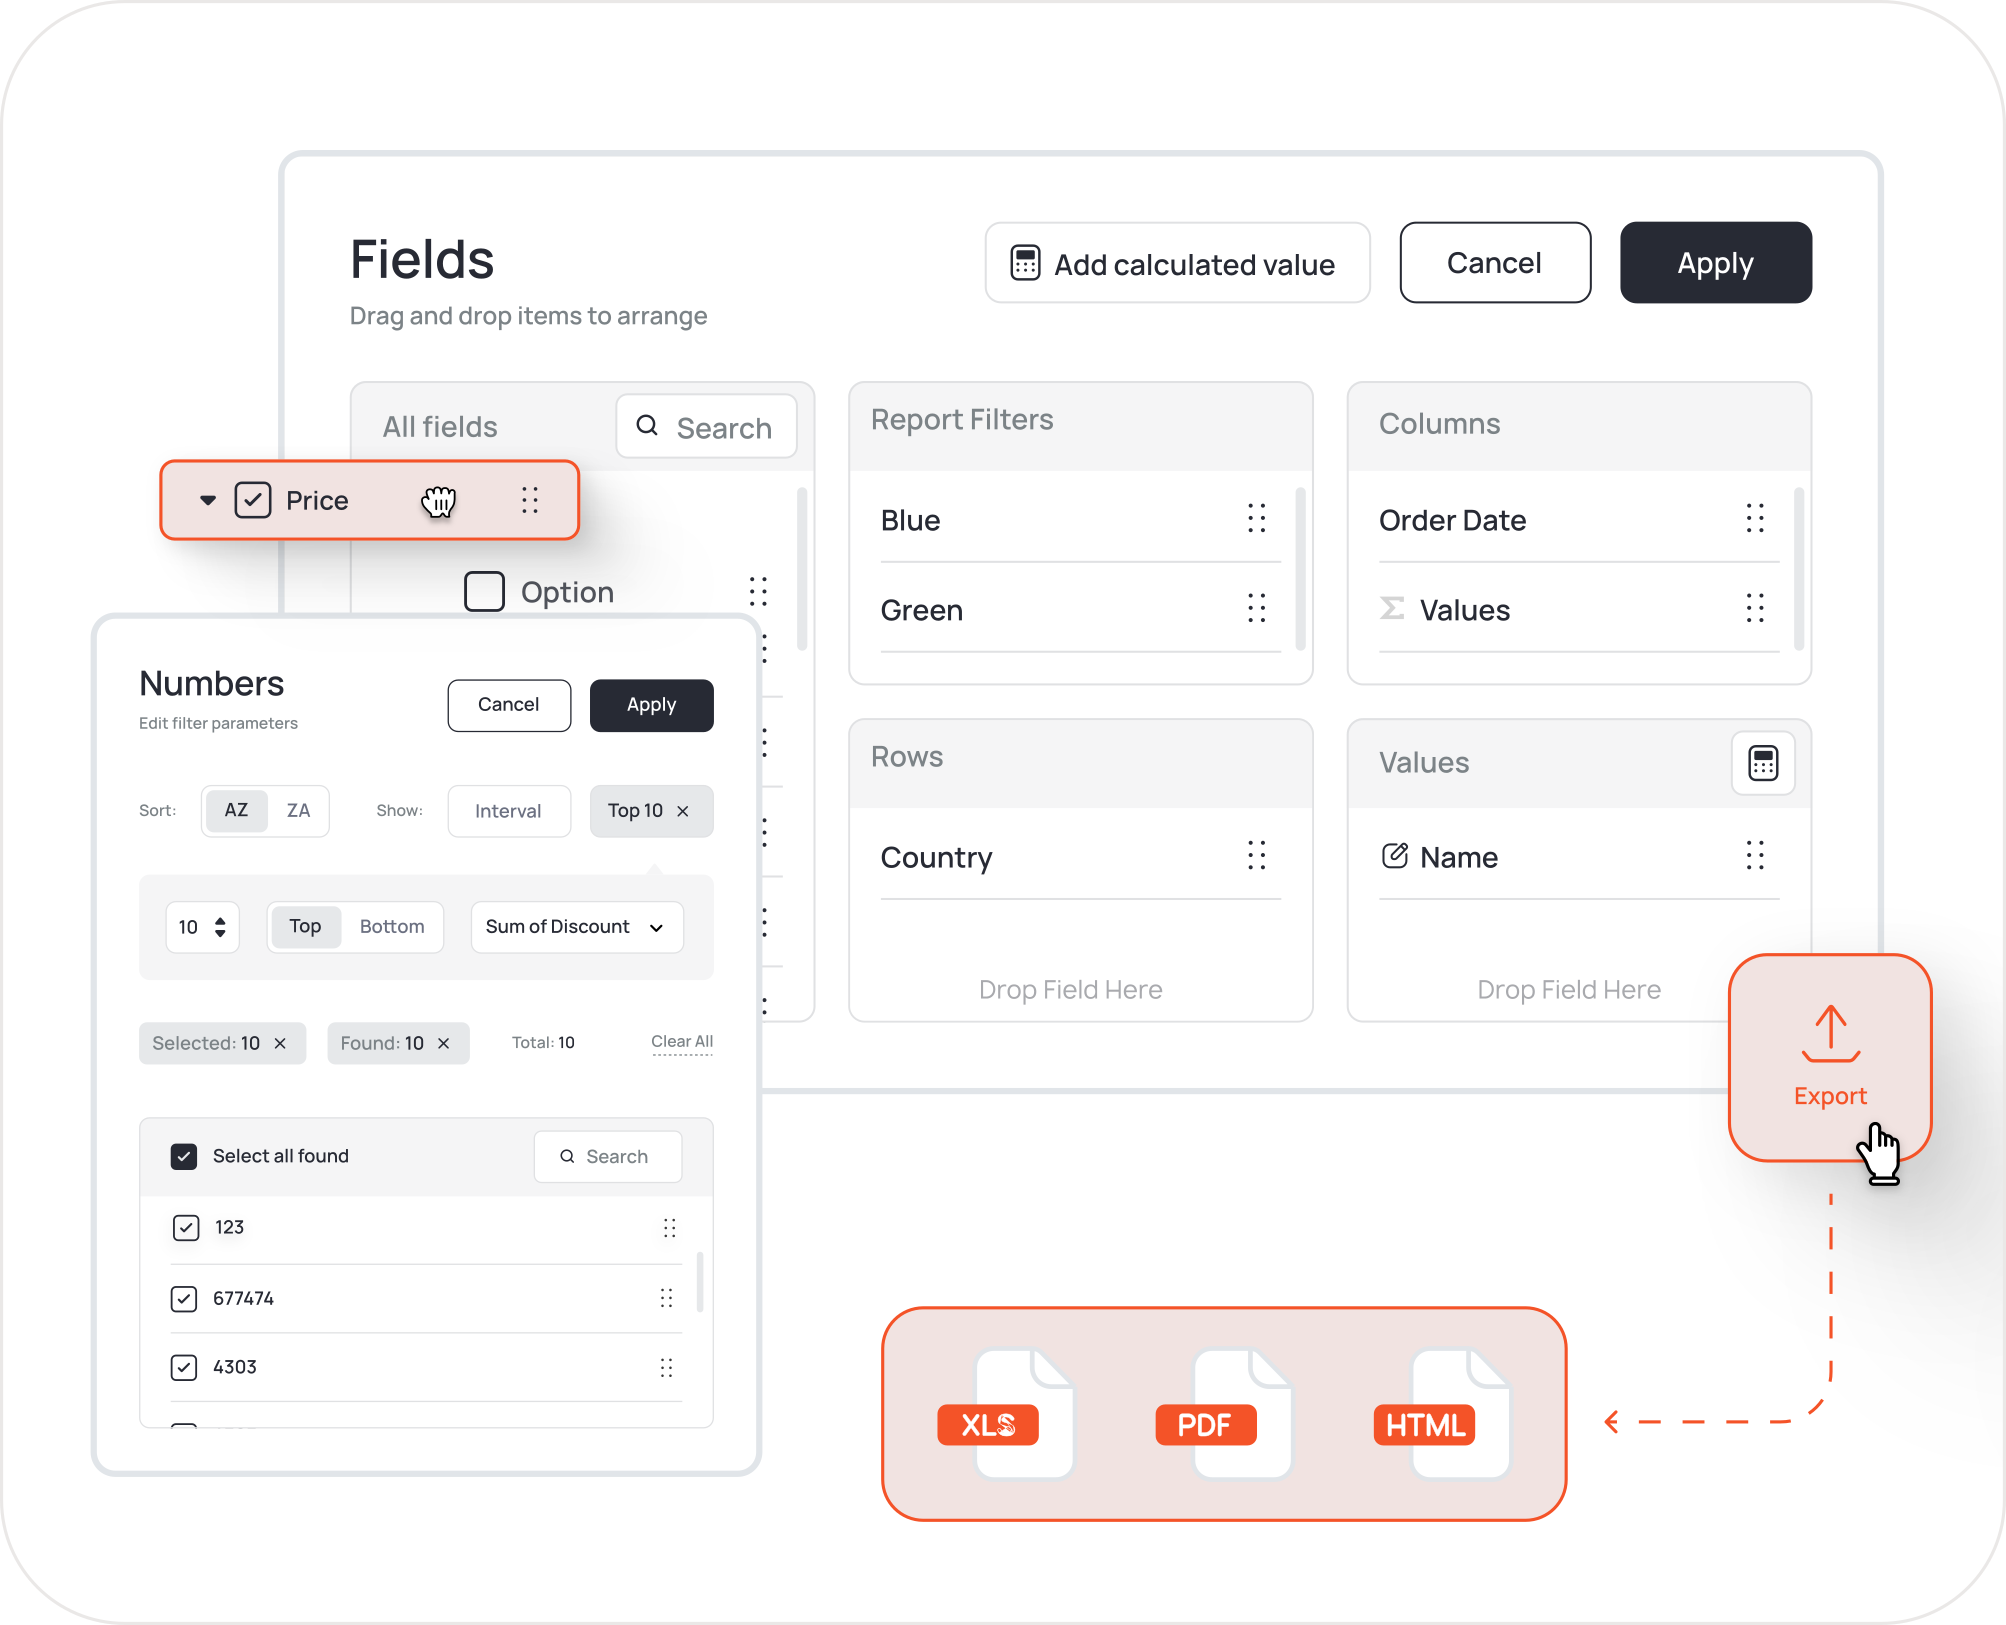
Get a set of pivot table features in a spreadsheet-like interface:
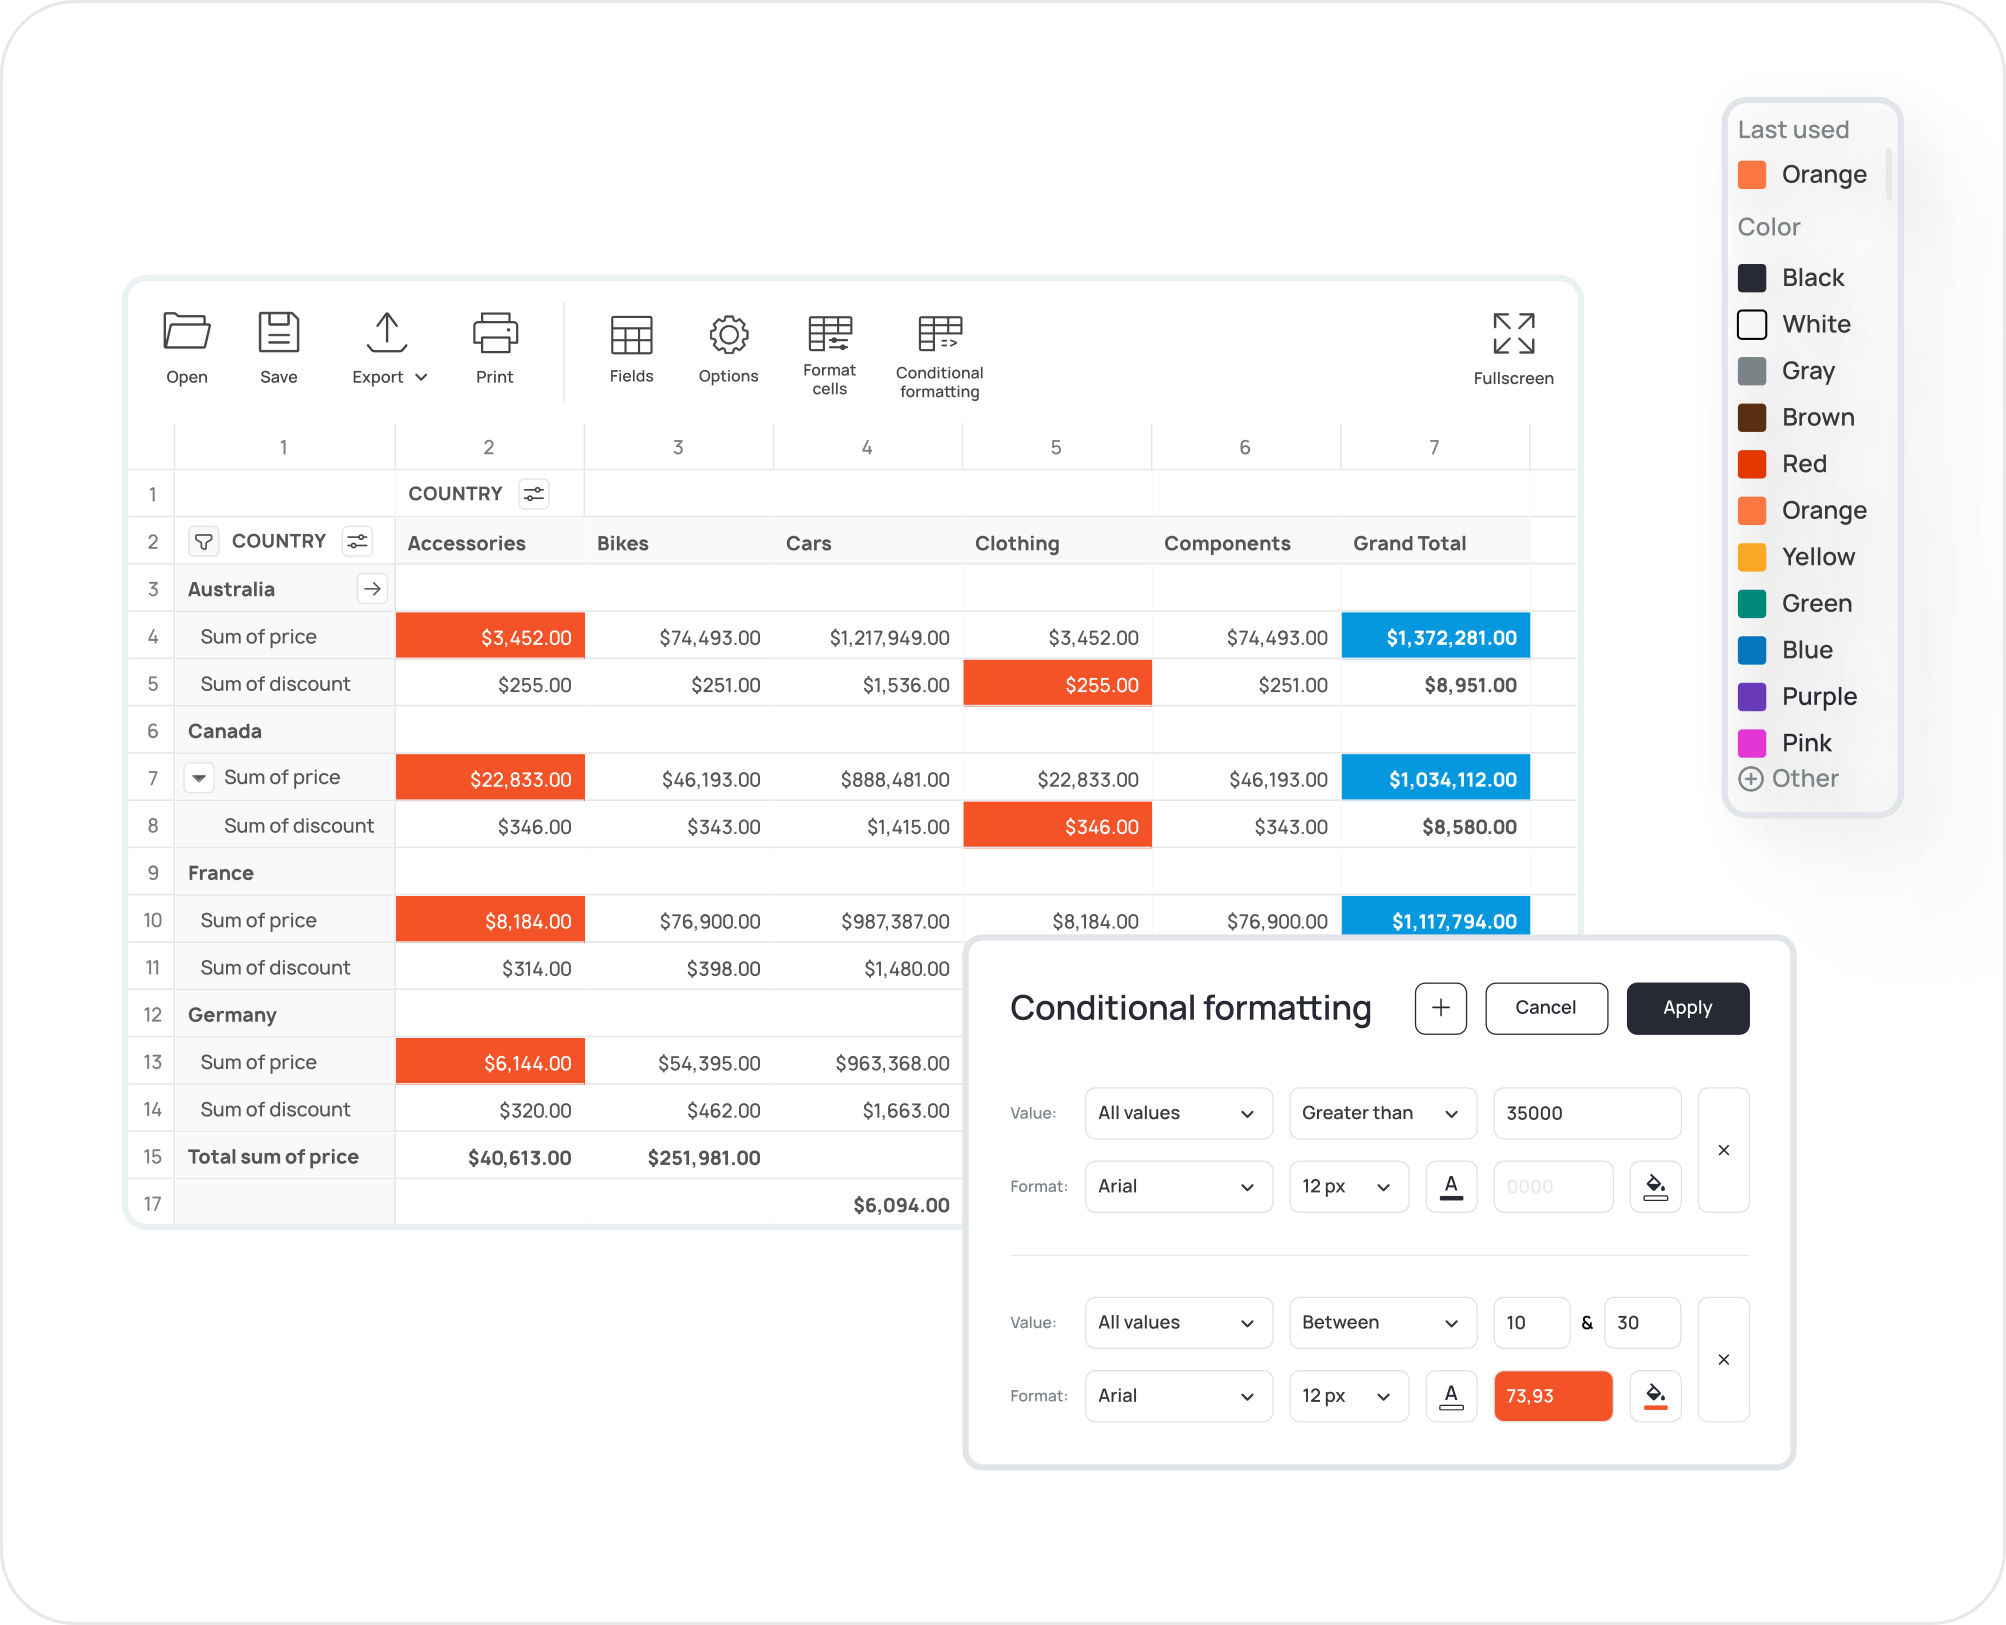
You can start using an intuitive and reliable user interface right after integration. We value our users' experience, so we apply leading approaches and mindful design to the logic of our component interface.
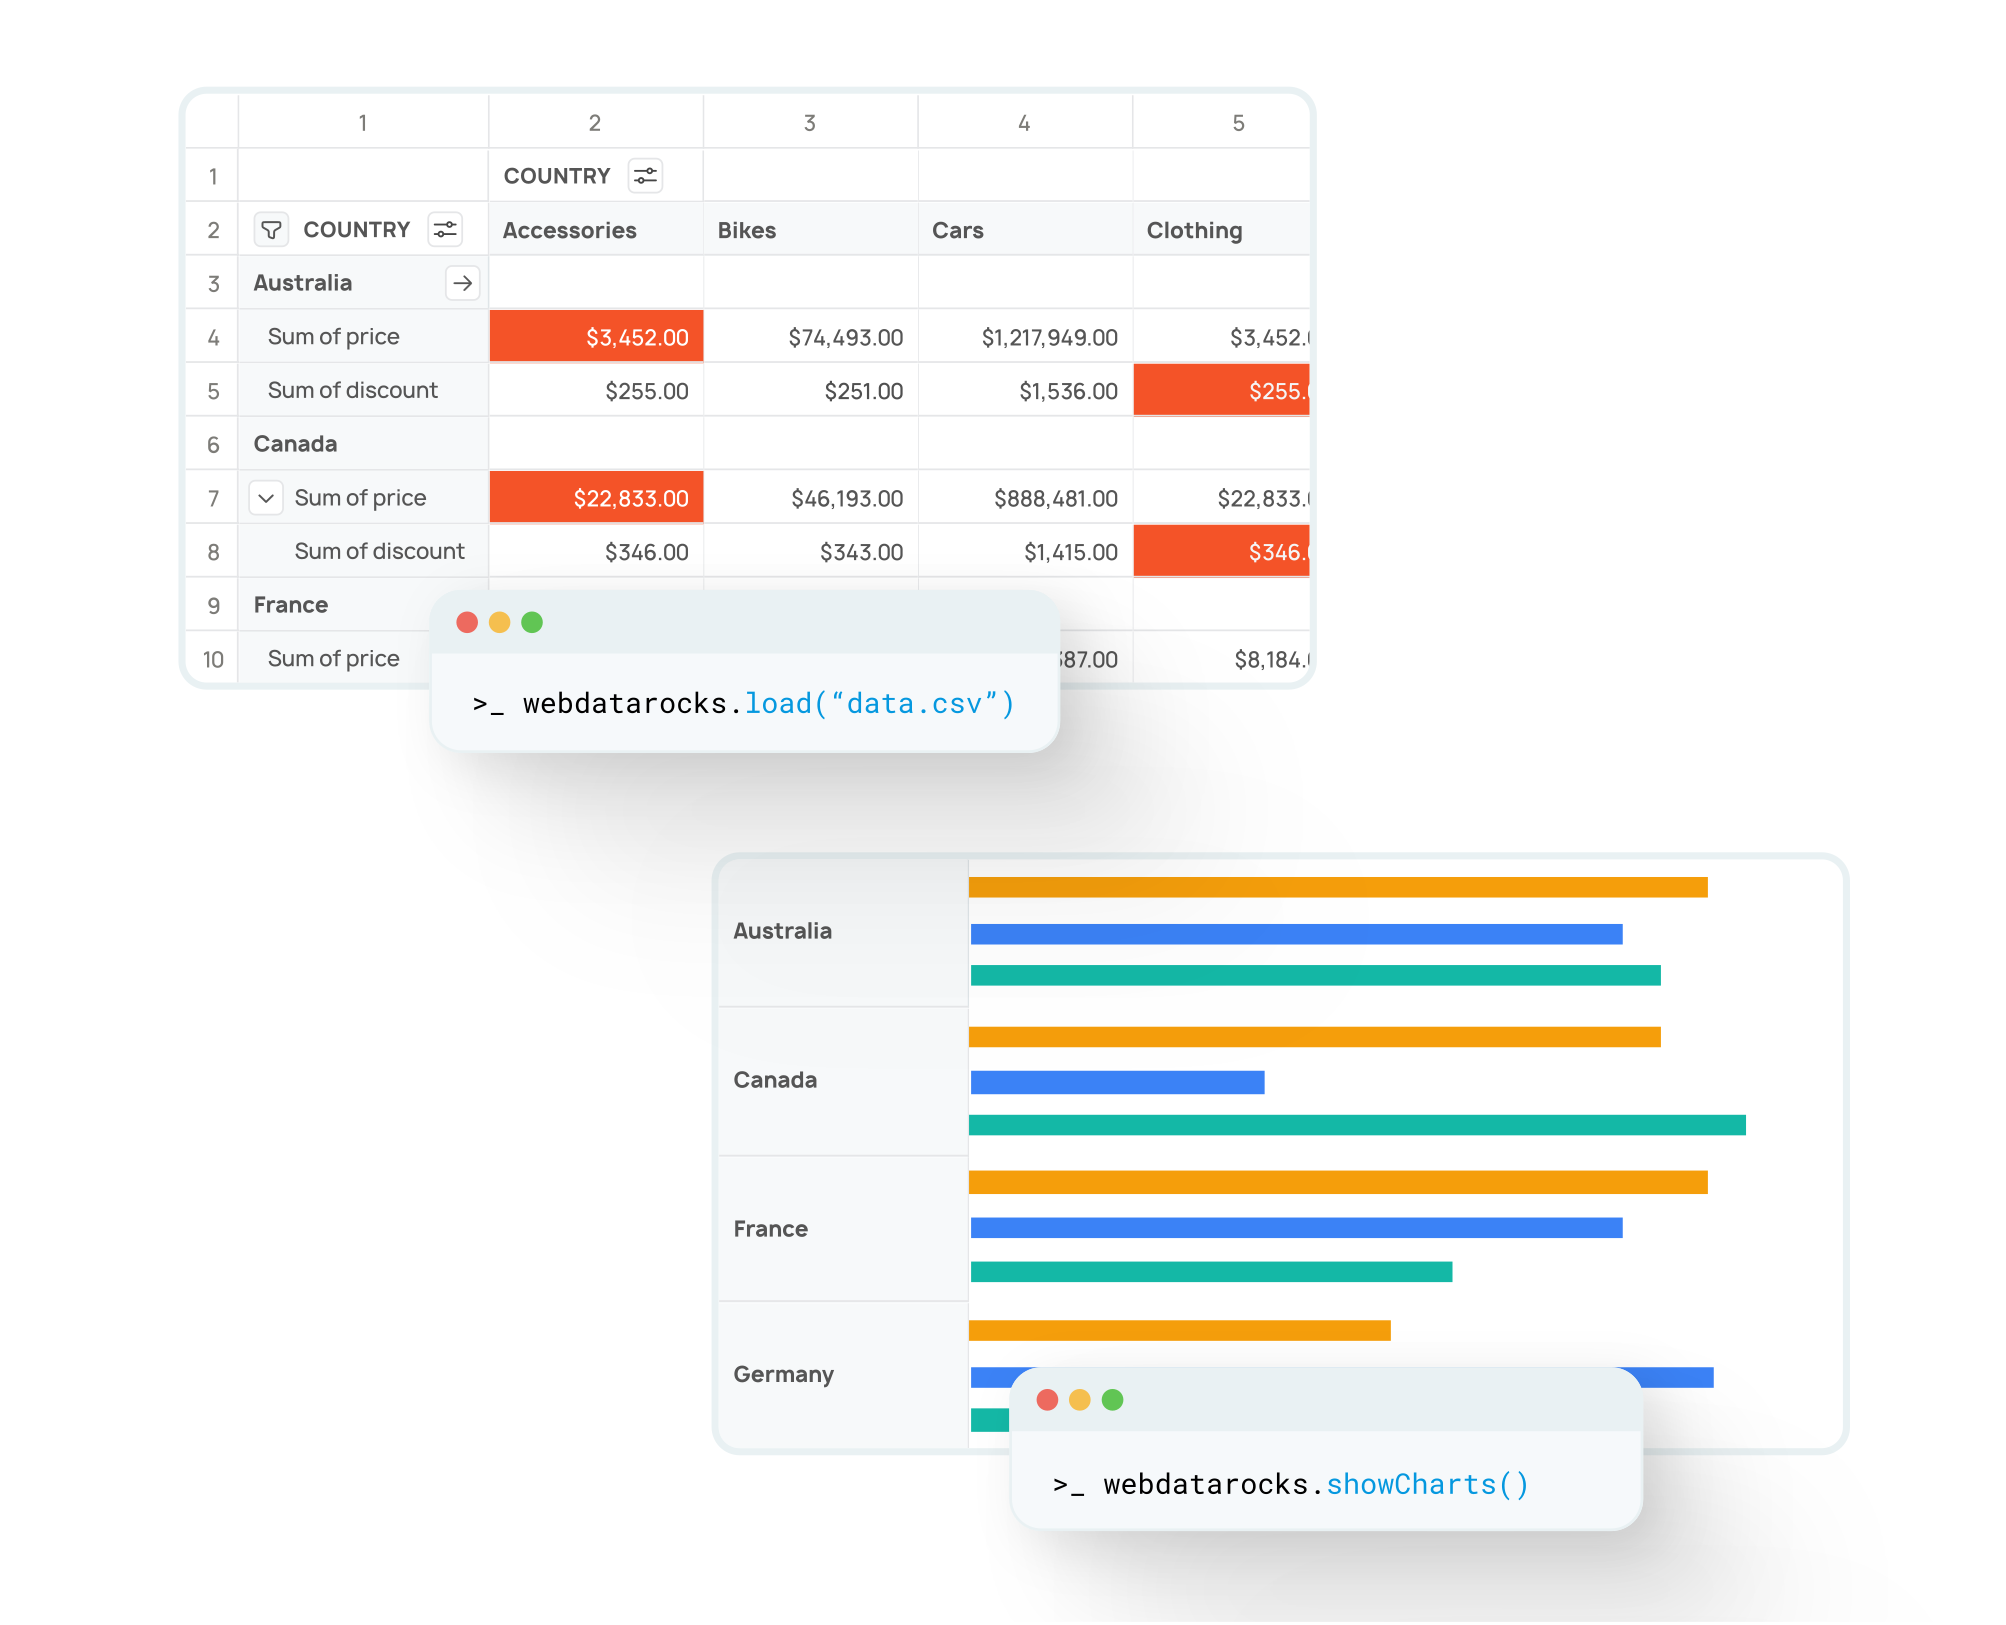
WebDataRocks is fully customizable — with our developer-friendly API, you decide what and how to display in your report. Easily tailor the component to fully match your project's analytics needs and branding.
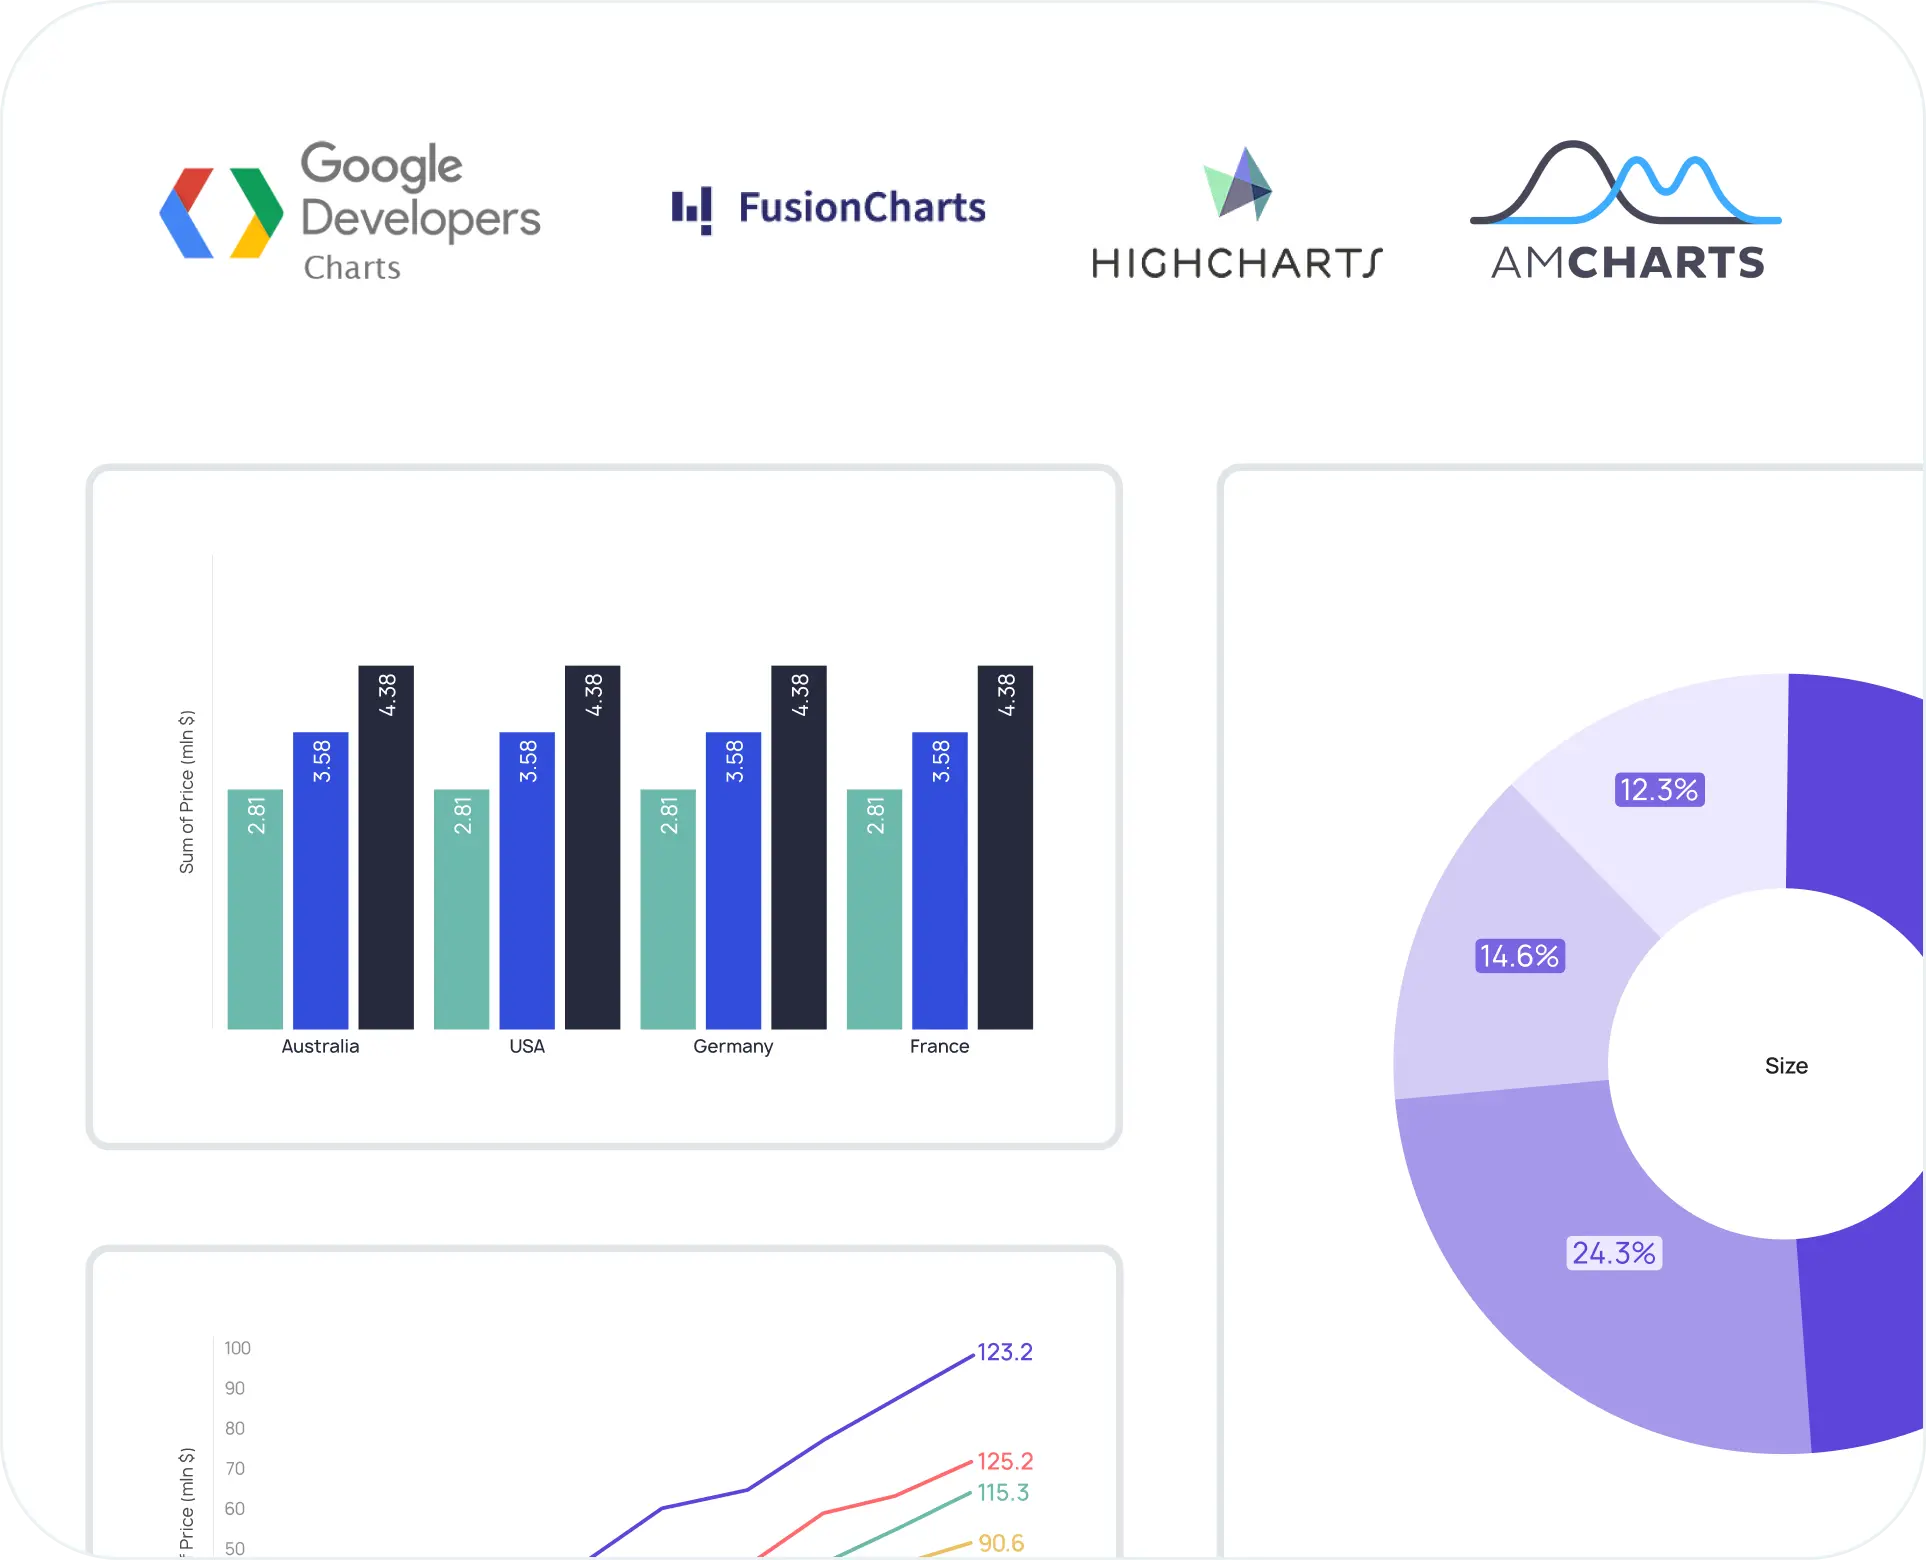
Create an interactive dashboard-like visualization of your data with other components. Integrate with 3rd-party charting libraries like Google Charts, Highcharts, FusionCharts, amCharts and others.
Take the first step by testing our feature-rich demo and play with all the available features.