Summer updates: meet new features & improvements of WebDataRocks
In this article
We’re excited to announce exciting updates to WebDataRocks! Dive into our latest release and discover powerful new aggregation functions like median, standard deviation, and running totals.
In WebDataRocks, we care about your reporting experience and make every effort to deliver value to you on a daily basis.
In the light of the new release, we are delighted to introduce to you new awesome aggregation functions and report themes enhancements.
New aggregations
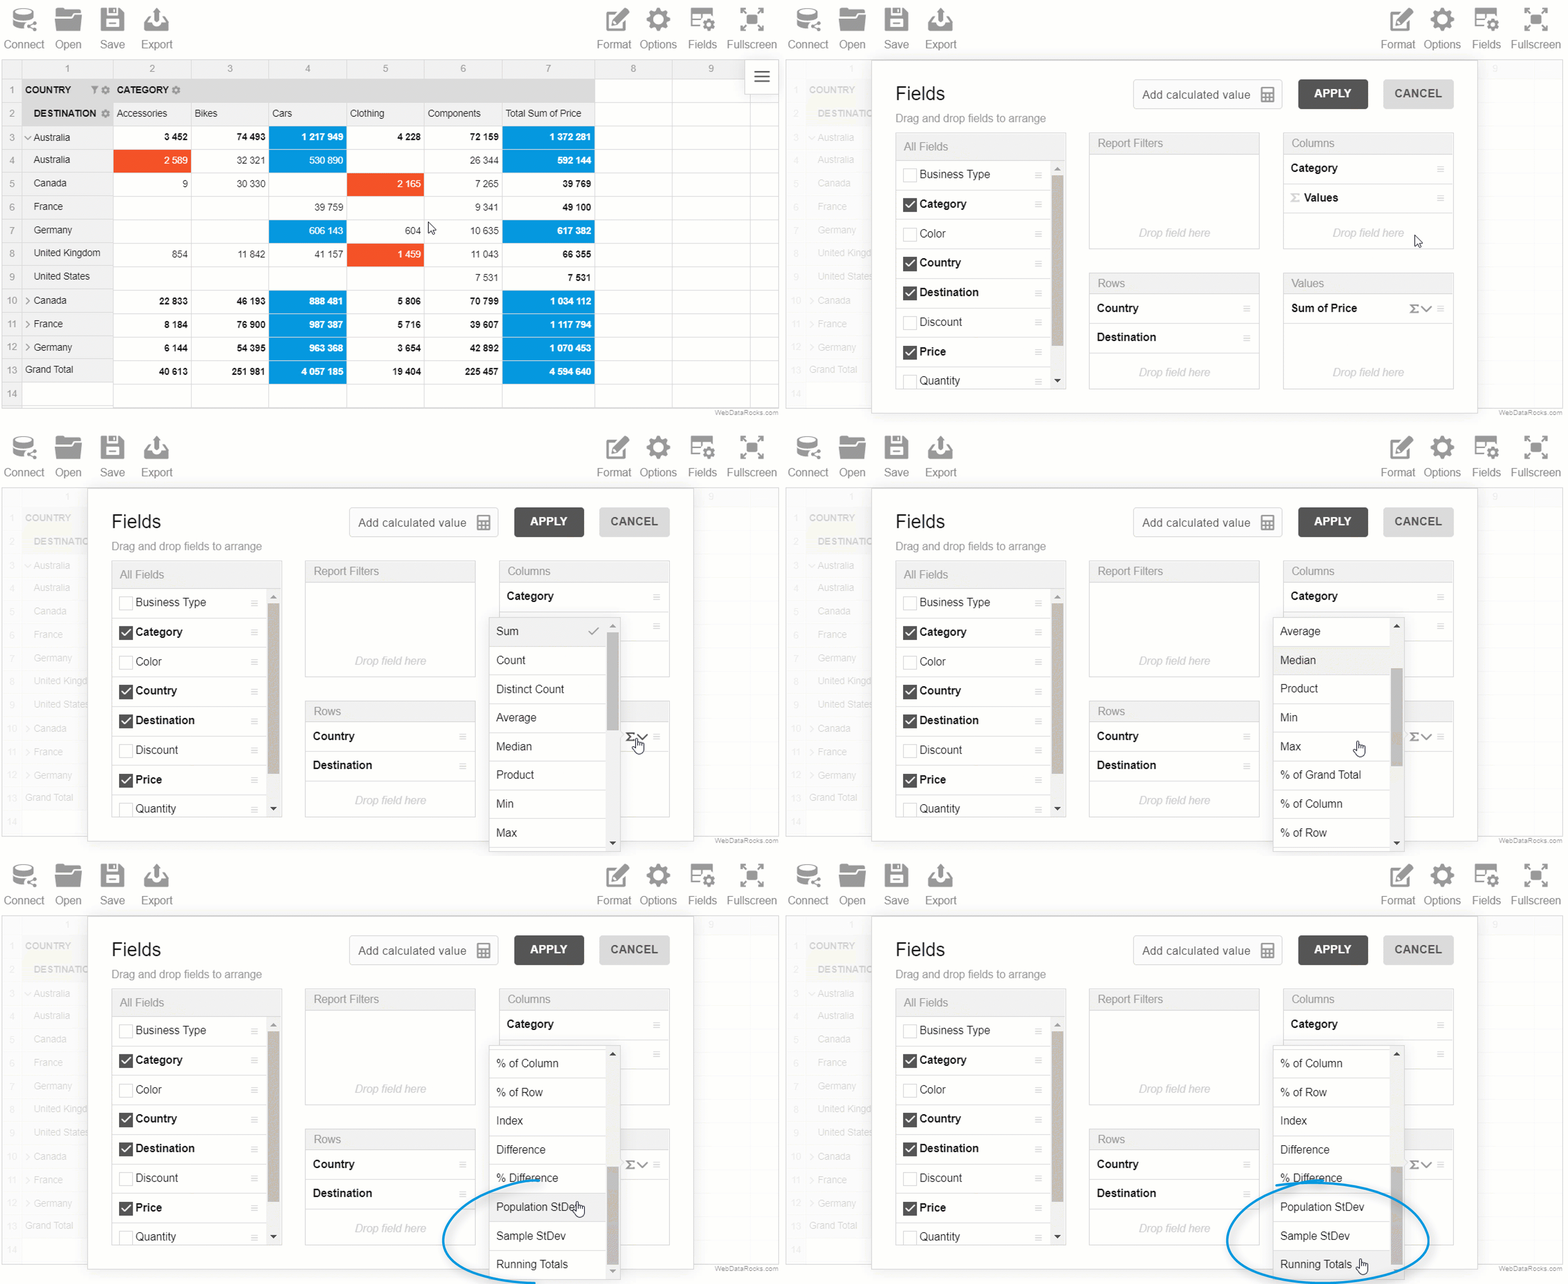
Starting from version 1.1.0, you can calculate the following measures right in the pivot table component:
- Running totals
- Median
- Sample standard deviation
- Population standard deviation

Let’s figure out why these aggregations may become handy for your reporting and data analysis.
As well as average, the median is extremely important in the statistical analysis since it represents the middle of a dataset. Unlike the mean (average), it’s less affected by outliers and skewed data.
The standard deviation is another important statistic (parameter) that helps to measure the spread of data distribution.
We implemented two versions of this aggregation – population and sample standard deviations.
One more aggregation you can benefit from is the running total aka cumulative sum. It’s simply a total which is changed every time a new value is added to the list of numbers. A nice thing about the running total is that you can check the total at any moment without having to sum the whole sequence every time.
Styles enhancement
The appearance of the reporting tool is no less important than its functionality.
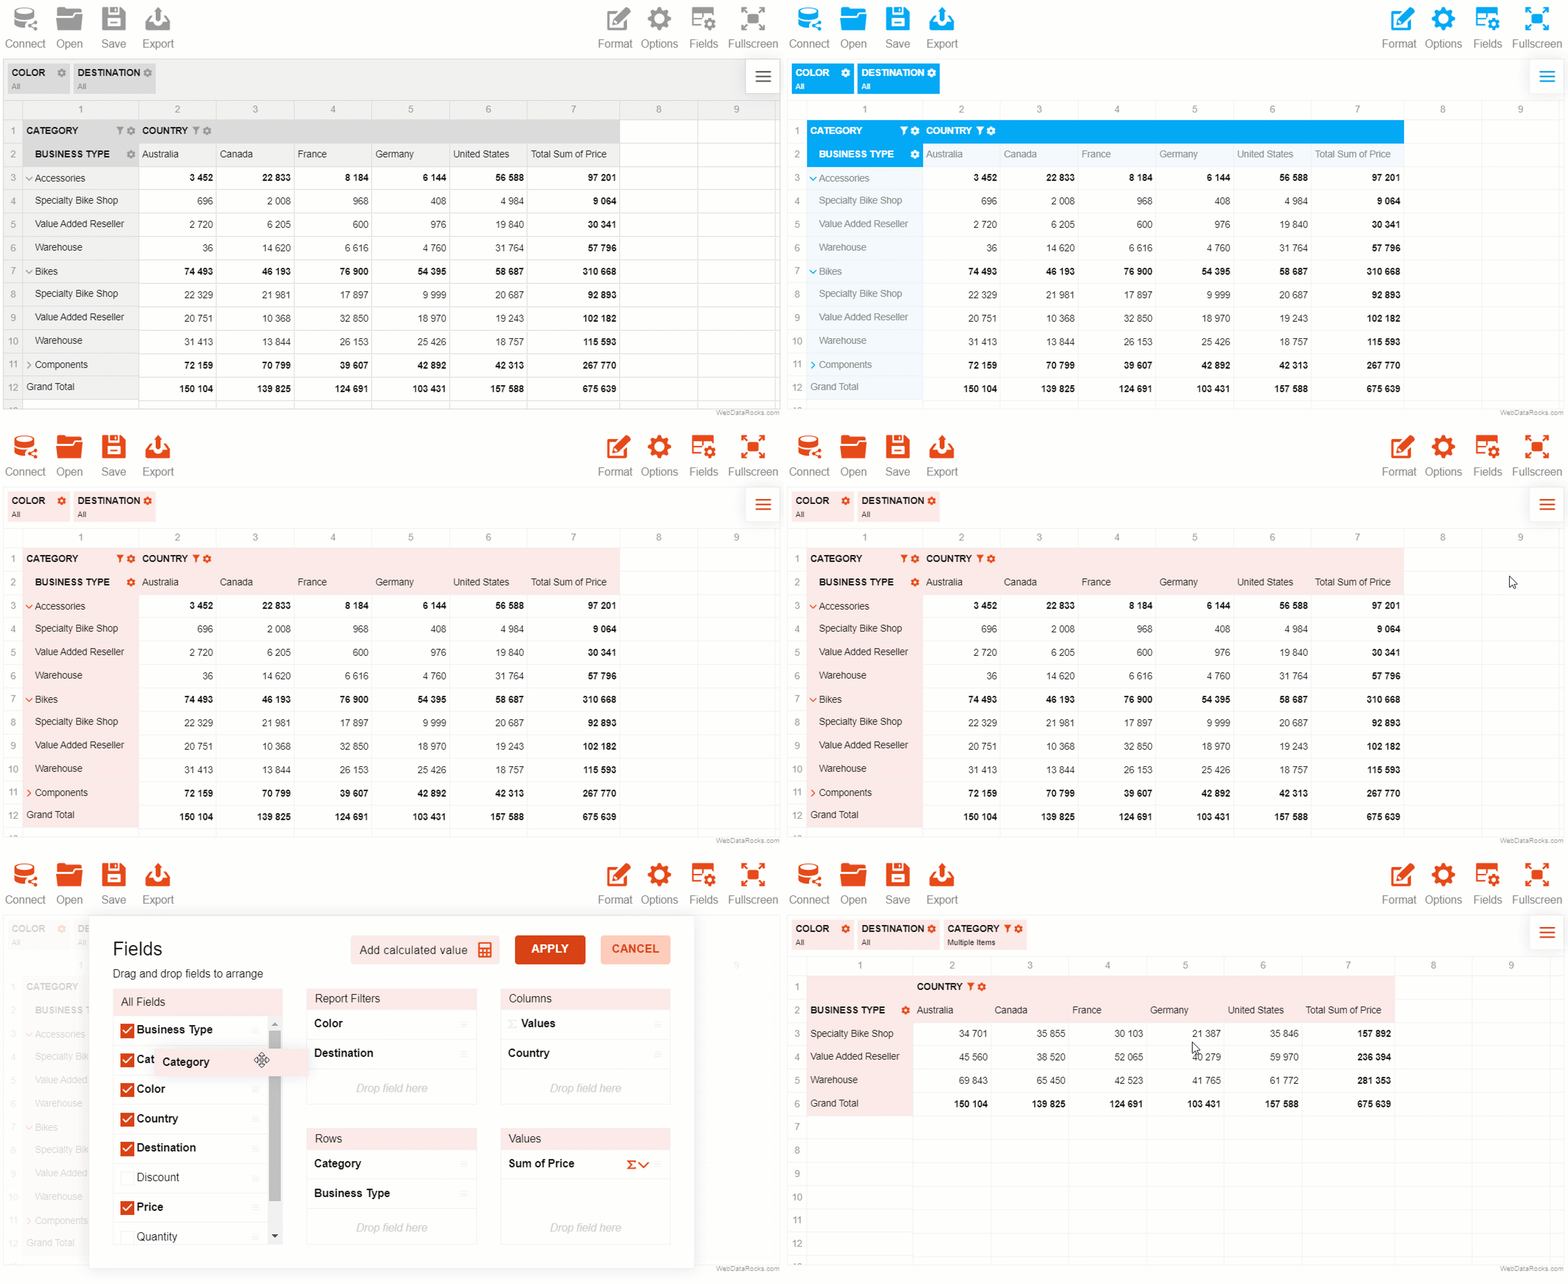
Therefore, we made minor improvements to lightblue and teal report themes and fixed issues with colors so as to make your pivot table stand out from the rest.

You can try all the themes in our demo.
Test new features now
Explore our demos to try new aggregations ?
Or install a new version of your favorite reporting tool via npm ✨
Thank you for entrusting your data analysis and reporting to WebDataRocks. We do our best to help you turn your raw data into rich and comprehensible reports.
There is much more to come.
Stay tuned to new updates!
Meet us on social media
Follow us on Twitter to keep track of the latest developments and tips & tricks on data visualization.
Subscribe to our CodePen profile to be the first to know about new mind-blowing demos.
What to read next?
- Learn about all aggregation functions in the Technical specifications section.
- Immerse into the purposes and features of a pivot table in our blog post.
- Need to improve your digital marketing strategy? And here the pivot table is ready to assist you.


