Moving from Excel to WebDataRocks
In this article
Tired of Excel’s limitations? It’s time to upgrade to WebDataRocks.
Microsoft Excel is spreadsheet software that has been a standard on the market of reporting tools for many years. It’s designed to assist you in summarizing and analyzing data or keeping it in tabular format. Excel is also loved for its diversity of mathematical formulas for every situation. They come in handy when you need to solve a complex mathematical problem.
Excel is one of the most widely used reporting software in the business world. A lot of small and large companies use it for different data analysis purposes.
But before investing in licensed software, you can try other solutions that offer more flexibility and allow visualizing data right in your app.
Today we’ll research on the features of two tools for reporting – WebDataRocks and Excel and compare the ways they provide reporting experience.
We hope this article will help you to pick what is right for you.
Overview of features: Excel
Interface & learning curve
Excel strikes with the available functionality related to data visualization. But once you are taken to its workspace, it’s easy to get lost among the variety of tabs and bars. Figuring out the purposes of each one may be overwhelming for a newcomer. It often takes a lot of time before you learn how to navigate swiftly and efficiently. In general, the learning curve for adapting to Excel can be described as steep. You need to invest a lot of time to learn how to do reporting rather than extracting value from the data.
Scalability & performance
Performance is always a key consideration in any data analysis and reporting process.
Excel ensures fast data access and processing because of the way it manipulates memory. When you are working with spreadsheets, an entire file is loaded into RAM. On the one hand, this approach speeds up data access. On the other hand, the whole document has to be reloaded into RAM again once you make any small change to your current workbook.
Thus, working with spreadsheets that contain large amounts of data (~ 200k records) can be rather slow and not efficient.
Customizability
If you are willing to change some parts of the interface, you can personalize the Ribbon, Quick Access Toolbar, change the language, etc. In this sense, Excel is customizable enough.
Integrations
Excel works with almost every other product of Office 365. You can add spreadsheets to presentations or text reports.
But to move data between Excel and any third-party app, you need to use external services since there are no off-the-shelf integration options available.
Working online
Not only can you use Excel as a desktop app but also in the web browser. Pay attention to the fact that there are certain variations in the functionality of both versions. However, it’s not possible to embed Excel into a web application.
Teamwork
Shared workbooks had many limitations previously but now you can use Excel for collaborative work with the help of the `Co-authoring` feature. Provided that you have a cloud-based version of Excel (as part of an Office 365 subscription), your colleagues can have remote access to your spreadsheets and see updates nearly in real-time. Without this subscription, another way to send a report is via an e-mail or a portable storage media which leads to duplicating information and is a neither secure nor convenient way to share the data.
Excel as a data storage
Many companies use Excel as a database. Despite certain similarities between spreadsheets and databases, Excel lacks the capabilities of a database management system. Spreadsheets can’t meet the requirements on data integrity, consistency, security, ease of updating and retrieval of data. Moreover, as mentioned before, multiple users can’t access and update such a kind of database at the same time if they don’t have ‘Co-authoring’ feature enabled.
Considering all, it’s more convenient and reliable to keep your data in relational databases rather than store it in spreadsheets.
What about Pivot Tables?
Excel is primarily known for its pivot tables – the most indispensable tool when it comes to summarizing the data and getting insights from it.
But be aware that adding pivot tables may affect the performance – they double increase the workbook’s size because of the large caches they require.
Cost
Excel is not expensive for companies but can be costly for individual users.
Conclusion
Many people use Excel because it’s comfortable and they get used to it.
But why not break out of your comfort zone and move towards web-based solutions? Especially if you have exhausted the possibilities of Excel’s pivot tables.
It’s worth to note that using web pivot table components instead of Excel pivot tables implies going to a programmatic approach. The advantage of such an approach is that you can embed the component into any app, fully control the access to it and tailor pretty much every aspect of your reporting experience.
And this is where WebDataRocks comes into play.
WebDataRocks
WebDataRocks is a client-side pivot table component designed to provide data analysts with summarized data in the form of a tabular report. You can easily embed this tool in your web application and empower your end-users with reporting.
Let’s see what it has to offer.
Interface & learning curve
To make your learning curve less steep, we developed a highly intuitive interface that enables you to concentrate solely on the reporting purposes without being distracted by redundant functionality. All vital features are at hand, most of them are accessible via the Toolbar.
Customizability
You can customize WebDataRocks according to the style of a particular application, add or remove tabs to/from the Toolbar, and leave only the features which you need. You can easily switch between different layouts, apply predefined themes, add icons to the cells, and change everything through the UI or in code to make the component look natively in your app.
Additionally, you can bring to life your ideas about design and create a custom report theme.
Flexibility
The previously mentioned customization options are what make WebDataRocks a flexible reporting tool that ideally suits Agile practices. In particular, it adapts to such Agile principles as continual improvement and flexible response to changes.
Integrations
As a developer, you can experience the freedom of integration with popular frameworks such as React, Angular, AngularJS, Vue, and more.
To facilitate the integration process, you can make use of the available tutorials:
Besides, you can follow an API-first approach with a lot of API calls that make interacting with the tool easier and allow building your scenarios around the component.
Responsiveness
Works perfectly on all browsers and mobile platforms. Looks natively in any app.
Charts
In Excel, you are limited to use default charts and apply a set of defined styles to them. Of course, you can install some add-ons of 3rd-party charting libraries but it takes time to figure out how to use them in Excel’s workspace.
Here is how we solved this problem in WebDataRocks – you can integrate the pivot table component with any charting library you like. All you need to do is to pivot your data and pass it to any kind of chart. To make things easier, we prepared a series of tutorials on integration with the most popular charting libraries. If your favorite library is not on the list, you can make use of webdatarocks.getData() method to preprocess the data accordingly to the format the chart requires.
Ease of use and configuration
With little or no IT help, you can set up a powerful data visualization tool in no time. The Quick start guide will walk you through the basics of working with the component.
Teamwork
We know how teamwork matters: it provides the company with a diversity of thoughts and perspectives. After installing your instance of a pivot table tool, you can give role-based online access to analytics inside the application. Moreover, you can customize it to make a read-only mode of the pivot table.
Saving reports
We protect you from losing your working results.
Save the report in a JSON file and restore it anytime.
Sharing results
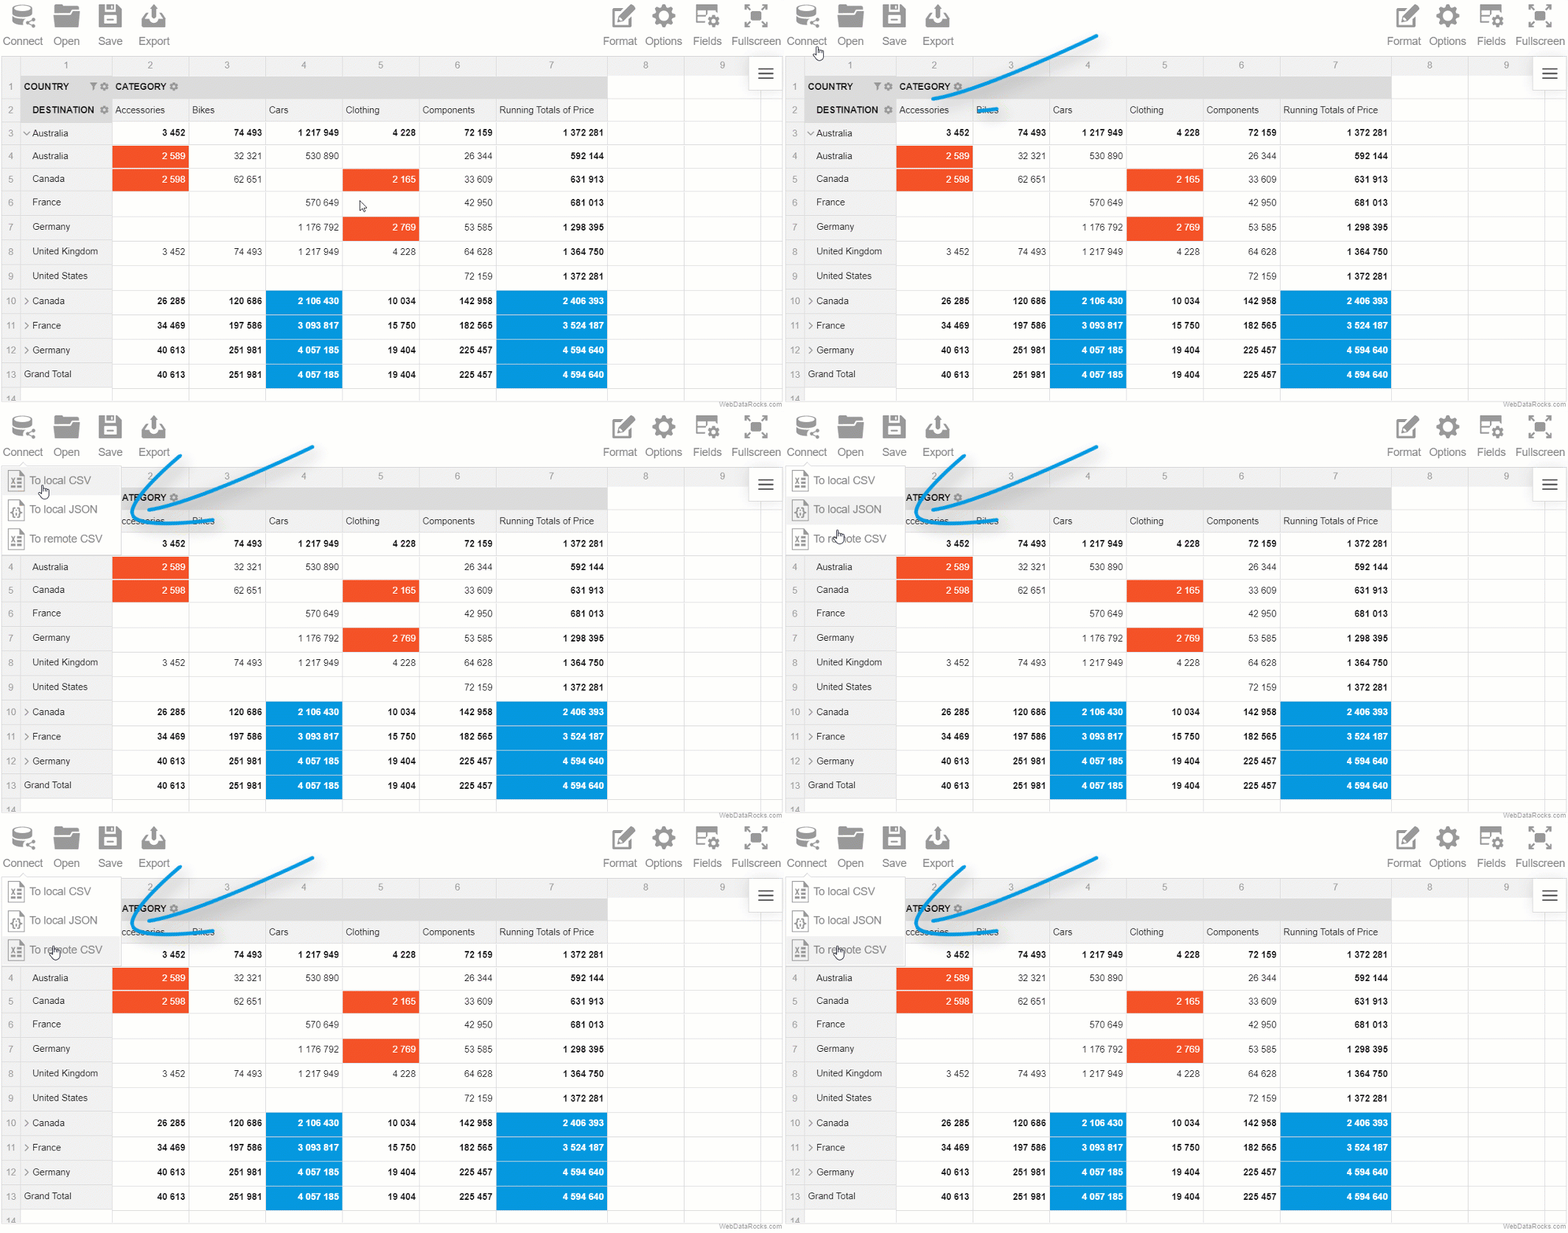
The exporting of reports is meant to be as fast as possible – WebDataRocks comes with exporting functionality bundled in which means there is no need to install custom plugins for exporting to PDF, HTML, and, of course, Excel. You can even send your report for printing. If you need to send the report to a server, it’s not a problem at all as well. To make that possible, you can customize exporting configurations with a few lines of code.
Data size
You can load up to the 1MB of data.
Cost
Free.
You can get WebDataRocks at no cost and save your money for other business investments.
Integration with Excel
To help you make the best of both Excel and WebDataRocks, we made a transition from Excel to WebDataRocks as smooth and simple as possible.
You can load your CSV data into the pivot table component and start pivoting your data in a new web-based interface.

Besides, if you feel you miss the spreadsheets and want to see the raw data, you can always switch to the flat mode and view non-aggregated data in a row-by-row manner.
Putting it all together
Today we reviewed the capabilities of a desktop reporting software (Excel) and a web-based pivot component (WebDataRocks). While the former is a great example of a standalone application, the latter can be successfully used as an integrated component of a larger Business Intelligence platform.
The choice is yours.
Live demos
How to become a better developer
Searching for ways to improve your programming skills? Try GitConnected – here you can find a rich collection of the most up-to-date coding tutorials.


